
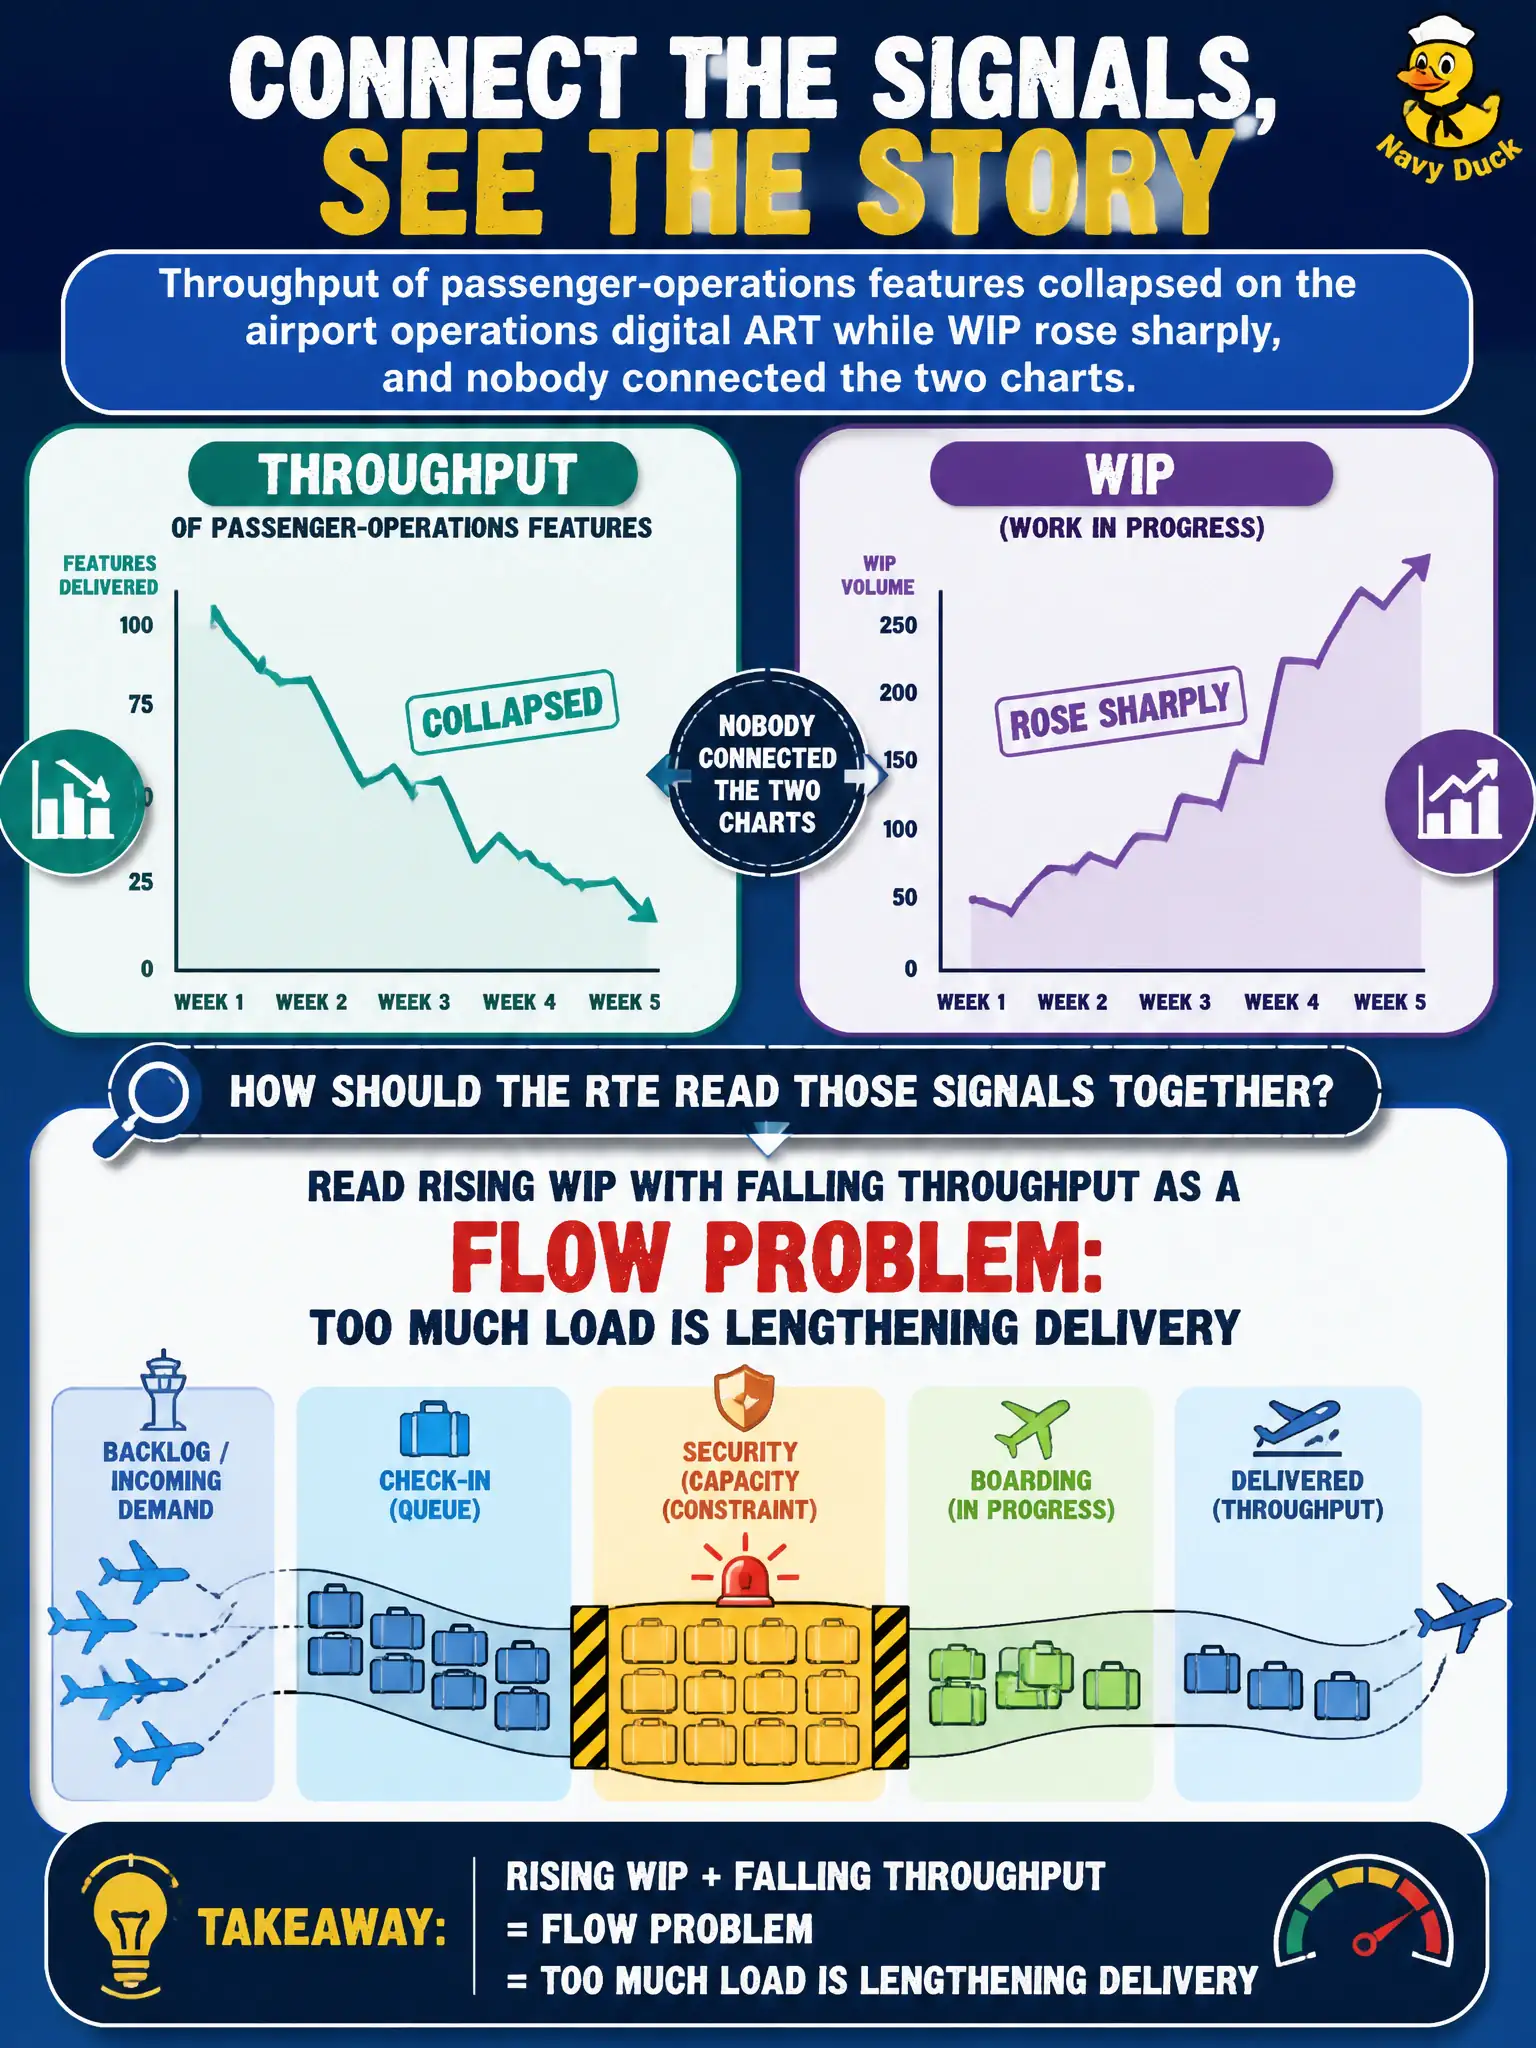
Throughput of passenger-operations features collapsed on the airport operations digital ART while WIP rose sharply, and nobody connected the two charts. How should the RTE read those signals together?
Select an answer to reveal the explanation.
Short Explanation
Picture a taxiway packed with planes that never take off. More work started plus fewer landings is not hustle—it is congestion. Read WIP and throughput together or the ART will cheer a traffic jam.
Full Explanation
Flow metrics must be read as a set. On an airport operations digital ART, sharply rising WIP with collapsing throughput is a congestion signal: too much load is lengthening delivery of passenger-operations features, not proof of commitment. Little's Law-style relationships imply that for a given completion rate, more work in process lengthens flow time; falling throughput with rising WIP confirms the ART is starting more than it finishes. Treating rising WIP as success because more work started confuses push overload with progress. Ignoring throughput while celebrating a larger in-progress column repeats that error and hides the taxiway jam. Resetting both charts to zero for a green airport board packet destroys the evidence needed for Inspect and Adapt and problem-solving. Exam caveat: a temporary WIP rise can be intentional during a planned ramp, but it must still be paired with throughput and flow-time review; unexplained WIP growth with falling throughput is not a stretch goal. Operational check: overlay WIP and throughput for the last several iterations in ART Sync, identify the passenger-operations constraint or policy driving starts, and set an experiment to limit new starts until in-flight items finish. Record the combined reading in the civic ART's measurement review so leaders stop cheering started work that never lands for travelers and operations staff.