
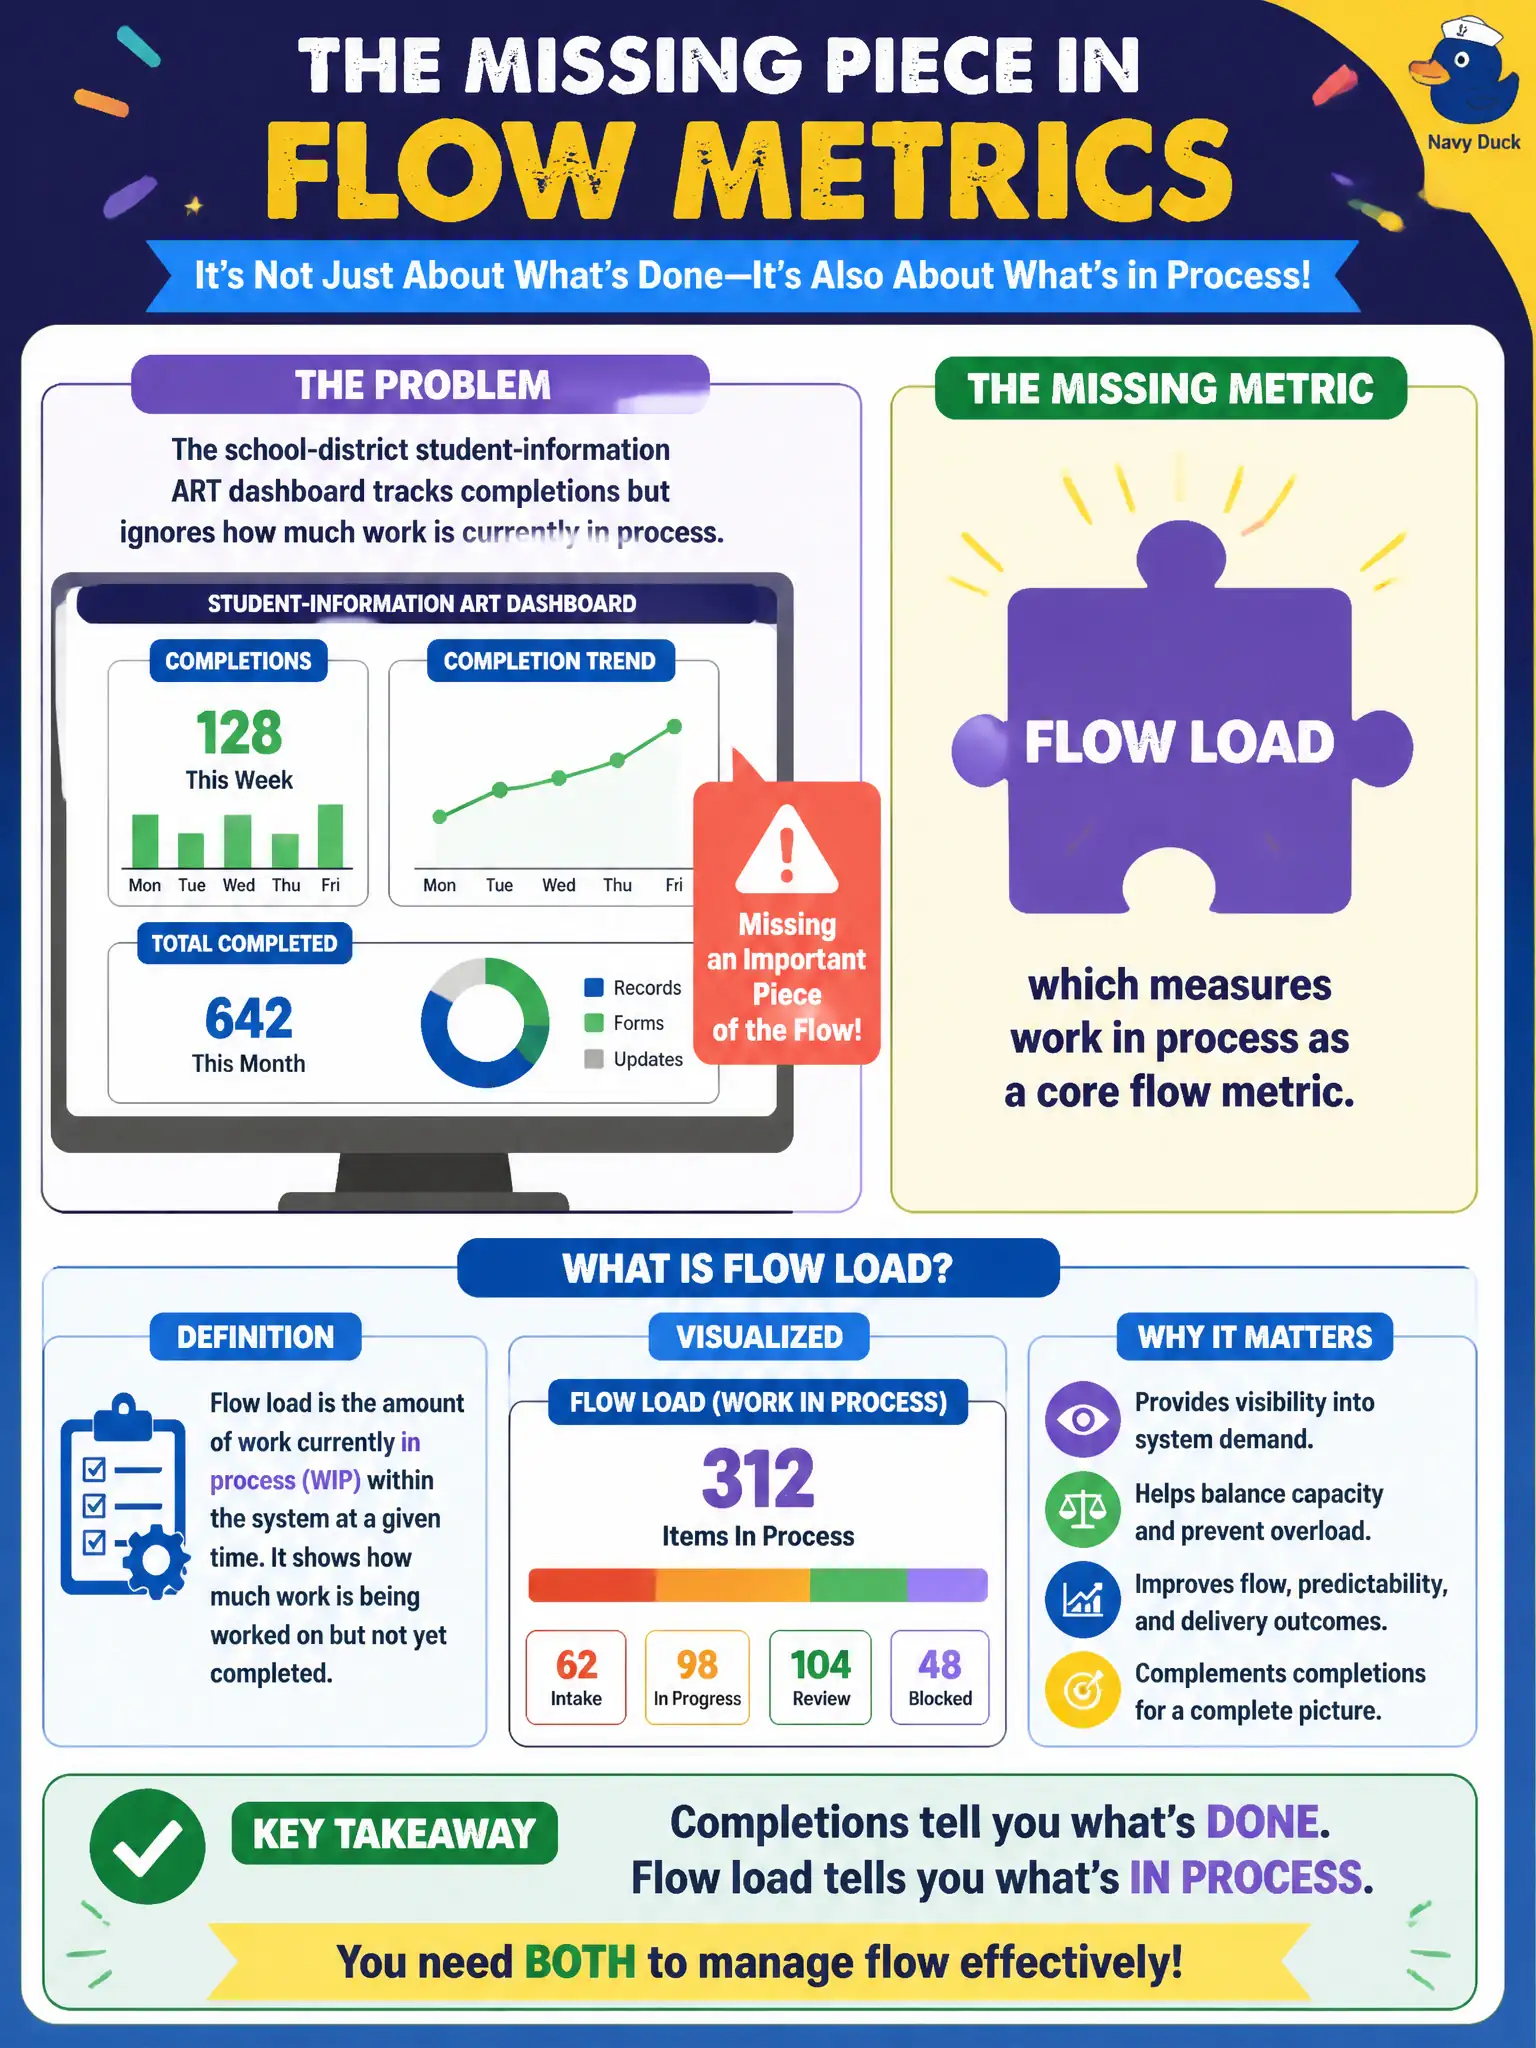
The school-district student-information ART dashboard tracks completions but ignores how much work is currently in process. Which flow metric is missing?
Select an answer to reveal the explanation.
Short Explanation
A dashboard that only counts report cards printed and ignores the stack still on teachers' desks is missing the pile. Flow load is that pile—WIP—and it is a core flow metric. Completions without load hide the jam in the student-information ART.
Full Explanation
Flow load measures work in process as a core flow metric. When a school-district student-information dashboard tracks completions but ignores how much work is currently in process, flow load is missing and congestion stays invisible to schools and families. Release on Demand count is not a substitute for WIP visibility because release events do not explain how overloaded the ART is right now. Business value scores address economic priority, not how many student-information items are simultaneously in flight across enrollment, transfers, and records. Team happiness surveys may be useful culture signals but do not measure WIP or predict enrollment-data delays that principals escalate. Exam caveat: high load often lengthens flow time—load should be read together with flow time, not in isolation, especially before school-year peaks. Operational check: display current WIP by state for student-information features and set an explicit load discussion in ART sync when WIP rises above the agreed threshold. Schools and families are hurt when student-information WIP explodes unseen; managing civic congestion requires load visibility beside completion counts every sync. Capture the load threshold and response in facilitation notes so the next school-year surge does not restart the debate from zero.