
A hospital infection-control team wants to know which patients are likely to share a ward outbreak. Each record stores age and diagnosis, and the team also knows which patients shared a room. Why does a graph fit this question better than a table of patient attributes alone?
Select an answer to reveal the explanation.
Short Explanation
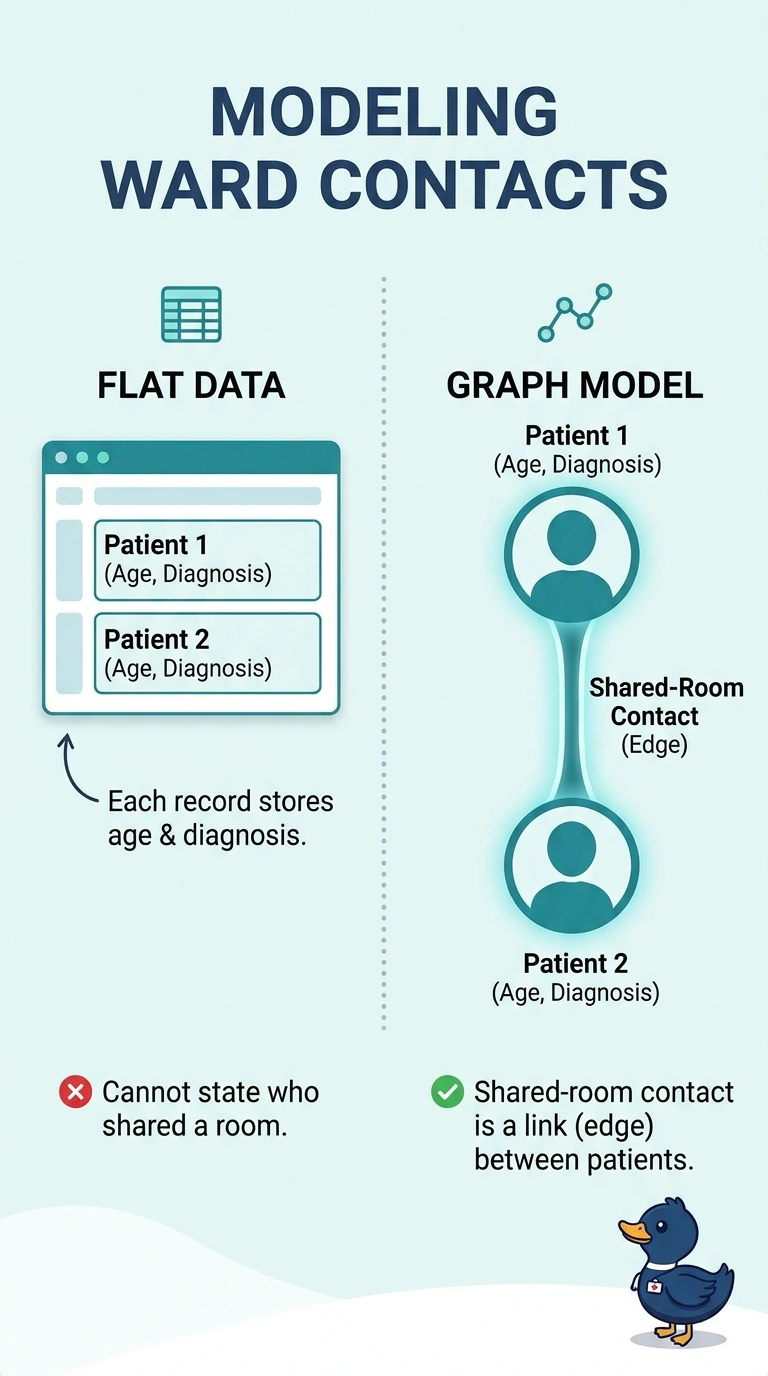
A seating chart tells you more than name tags when the question is who sat together. Outbreak risk lives on the shared-room links, so you want a graph of those edges rather than ages and diagnoses alone. The trap is thinking each patient's own attributes already contain the contact.
Full Explanation
The question is about contact: which patients shared a room, not only what each chart says about one person. A graph puts patients on nodes and shared-room contacts on edges, so a path or a neighborhood can represent who could pass an infection to whom. Attributes such as age and diagnosis can still sit on the nodes, but a table of those columns has no place for the pairwise link the outbreak depends on. Treating age and diagnosis as if they already encoded room-sharing confuses a property of one patient with a relationship between two patients. Needing a graph because the census is large confuses scale with structure; a table stores attributes at any ordinary ward size and still misses the edges. Dropping the edges and clustering on attributes answers a similarity question, not a contact question, and it throws away the only data that says who shared a room. Exam caveat: node attributes can improve a graph model; they do not replace edges when the decision is about links. Operational check: confirm the training extract includes an edge list or adjacency of shared rooms, not only a patient-by-attribute matrix.