
A county facilities coordinator wants a single schedule view that compares the locked baseline bars for a library renovation against where work sits today. Which predictive monitoring artifact best provides that comparison?
Select an answer to reveal the explanation.
Short Explanation
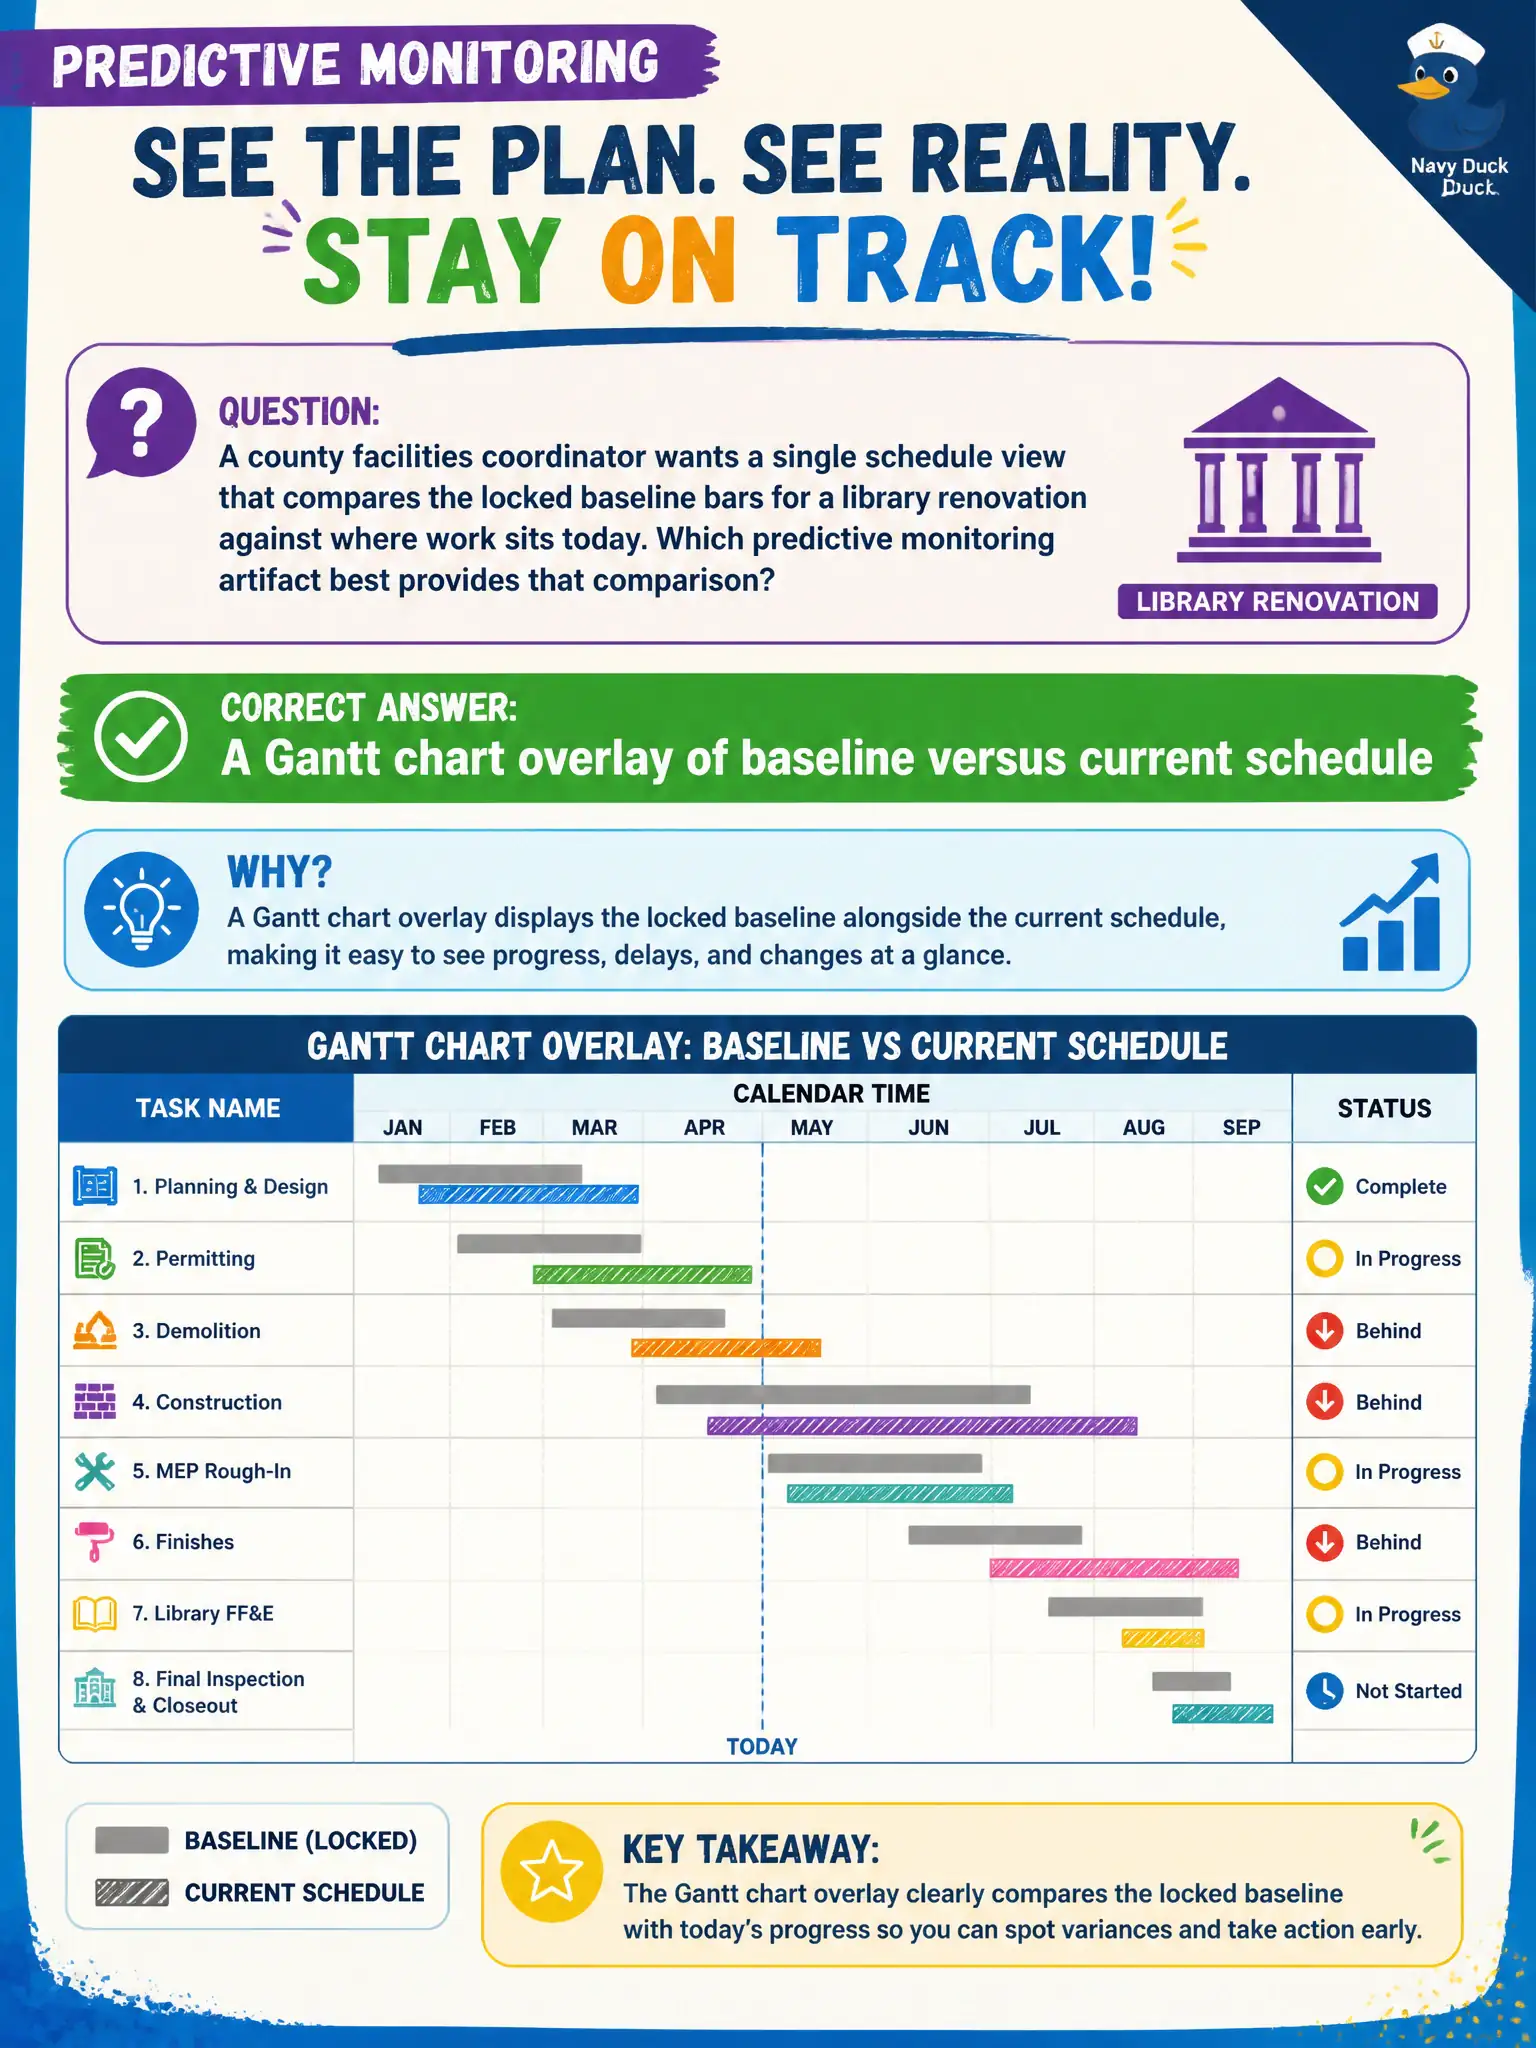
A baseline-versus-current Gantt overlay is like laying a translucent map of the planned renovation path on top of today's progress — you see slips and pulls at a glance. Emoji boards and RFI logs do not show bar-by-bar schedule drift. That visual is a classic predictive monitoring artifact.
Full Explanation
A county facilities coordinator comparing locked baseline bars for a library renovation against where work sits today needs a Gantt chart overlay of baseline versus current schedule. That predictive monitoring view places planned bars beside or beneath actual/current bars so slips, pulls, and remaining duration are visible in one schedule picture. It is the classic plan-based artifact for answering "where are we versus the approved timeline" without converting the conversation into unrelated agile or procurement lists.
A stakeholder happiness emoji board with no dates fails conceptually because sentiment without schedule structure cannot compare baseline to current timing. A procurement RFI log without schedule bars fails because RFIs track vendor questions, not the time-phased baseline-versus-actual position of renovation activities. A Definition of Done checklist for unrelated software stories fails because DoD is an adaptive quality agreement for increments, not a predictive schedule comparison tool for a facilities renovation.
Exam caveat: Associates should match the monitoring artifact to the life cycle and the question being asked—here, schedule baseline versus current status—rather than offering popular agile or procurement documents by habit. Operational check: publish a baseline-versus-current Gantt for the library renovation, highlight slipped activities that threaten opening milestones, and use that view in the next facilities status meeting to drive schedule recovery actions.