
A hydroelectric plant stores four collections: a table of turbine IDs and nameplate watts, an hourly river-gauge history, still photos of the spillway gates, and free-text operator shift notes. Which pairing matches each collection to its modality?
Select an answer to reveal the explanation.
Short Explanation
Think of four different inboxes. Turbine IDs live in a spreadsheet (tabular), the river gauge is a heartbeat over time (time-series), spillway shots are pictures (image), and shift notes are sentences (text). A photo of a moving gate is still an image, not a time-series table.
Full Explanation
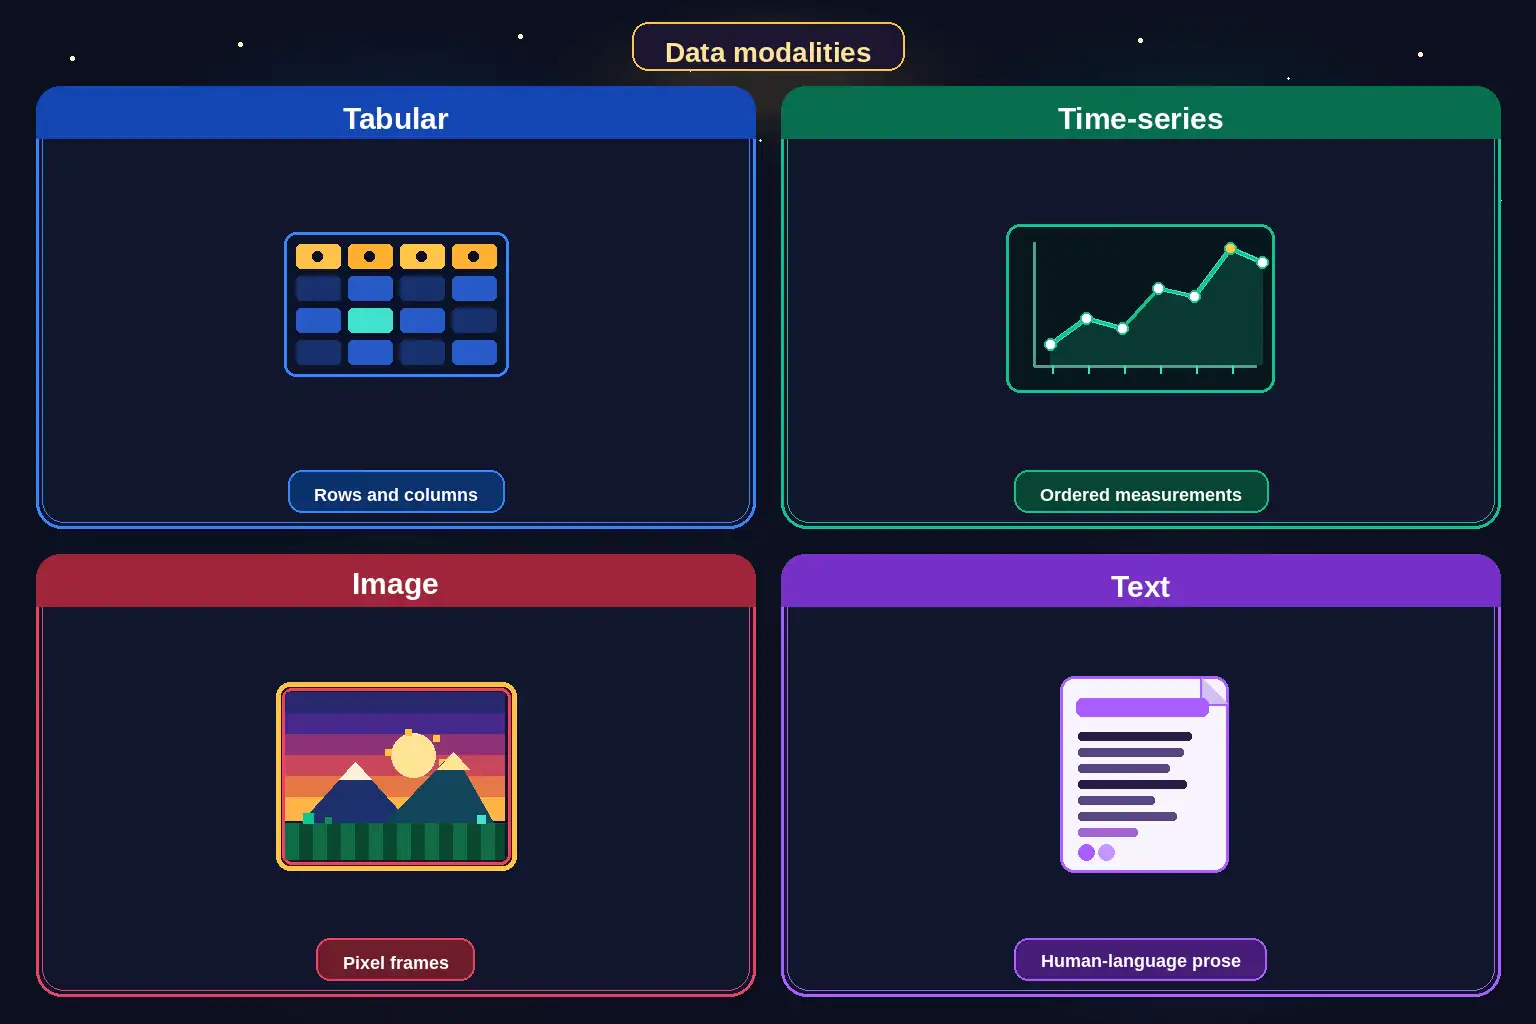
Data modalities map to how information is organized: tabular for rows and columns of attributes, time-series for ordered measurements over time, image for pixel frames, and text for human-language prose. The turbine ID and nameplate-watts table is tabular. The hourly river-gauge history is time-series. Spillway still photos are image data. Operator shift notes are text. That pairing is the accurate modality map.
Calling spillway photos time-series because gates move confuses subject motion with data type; a still photo remains image data, while time-series would be ordered gauge or gate-position readings. Calling shift notes tabular because they are saved in files confuses storage with schema; free-text notes are text. Calling the river gauge text is wrong—it is numeric measurements over time. Claiming all four collections are unstructured audio ignores every stated modality.
Exam caveat: modality follows representation, not the physical asset—photos of moving equipment are still images unless you store an ordered signal instead. Operational check: inventory each store with a modality tag (tabular / time-series / image / text), choose models and feature pipelines per tag, and avoid feeding shift-note prose into a time-series forecaster without NLP conversion.