
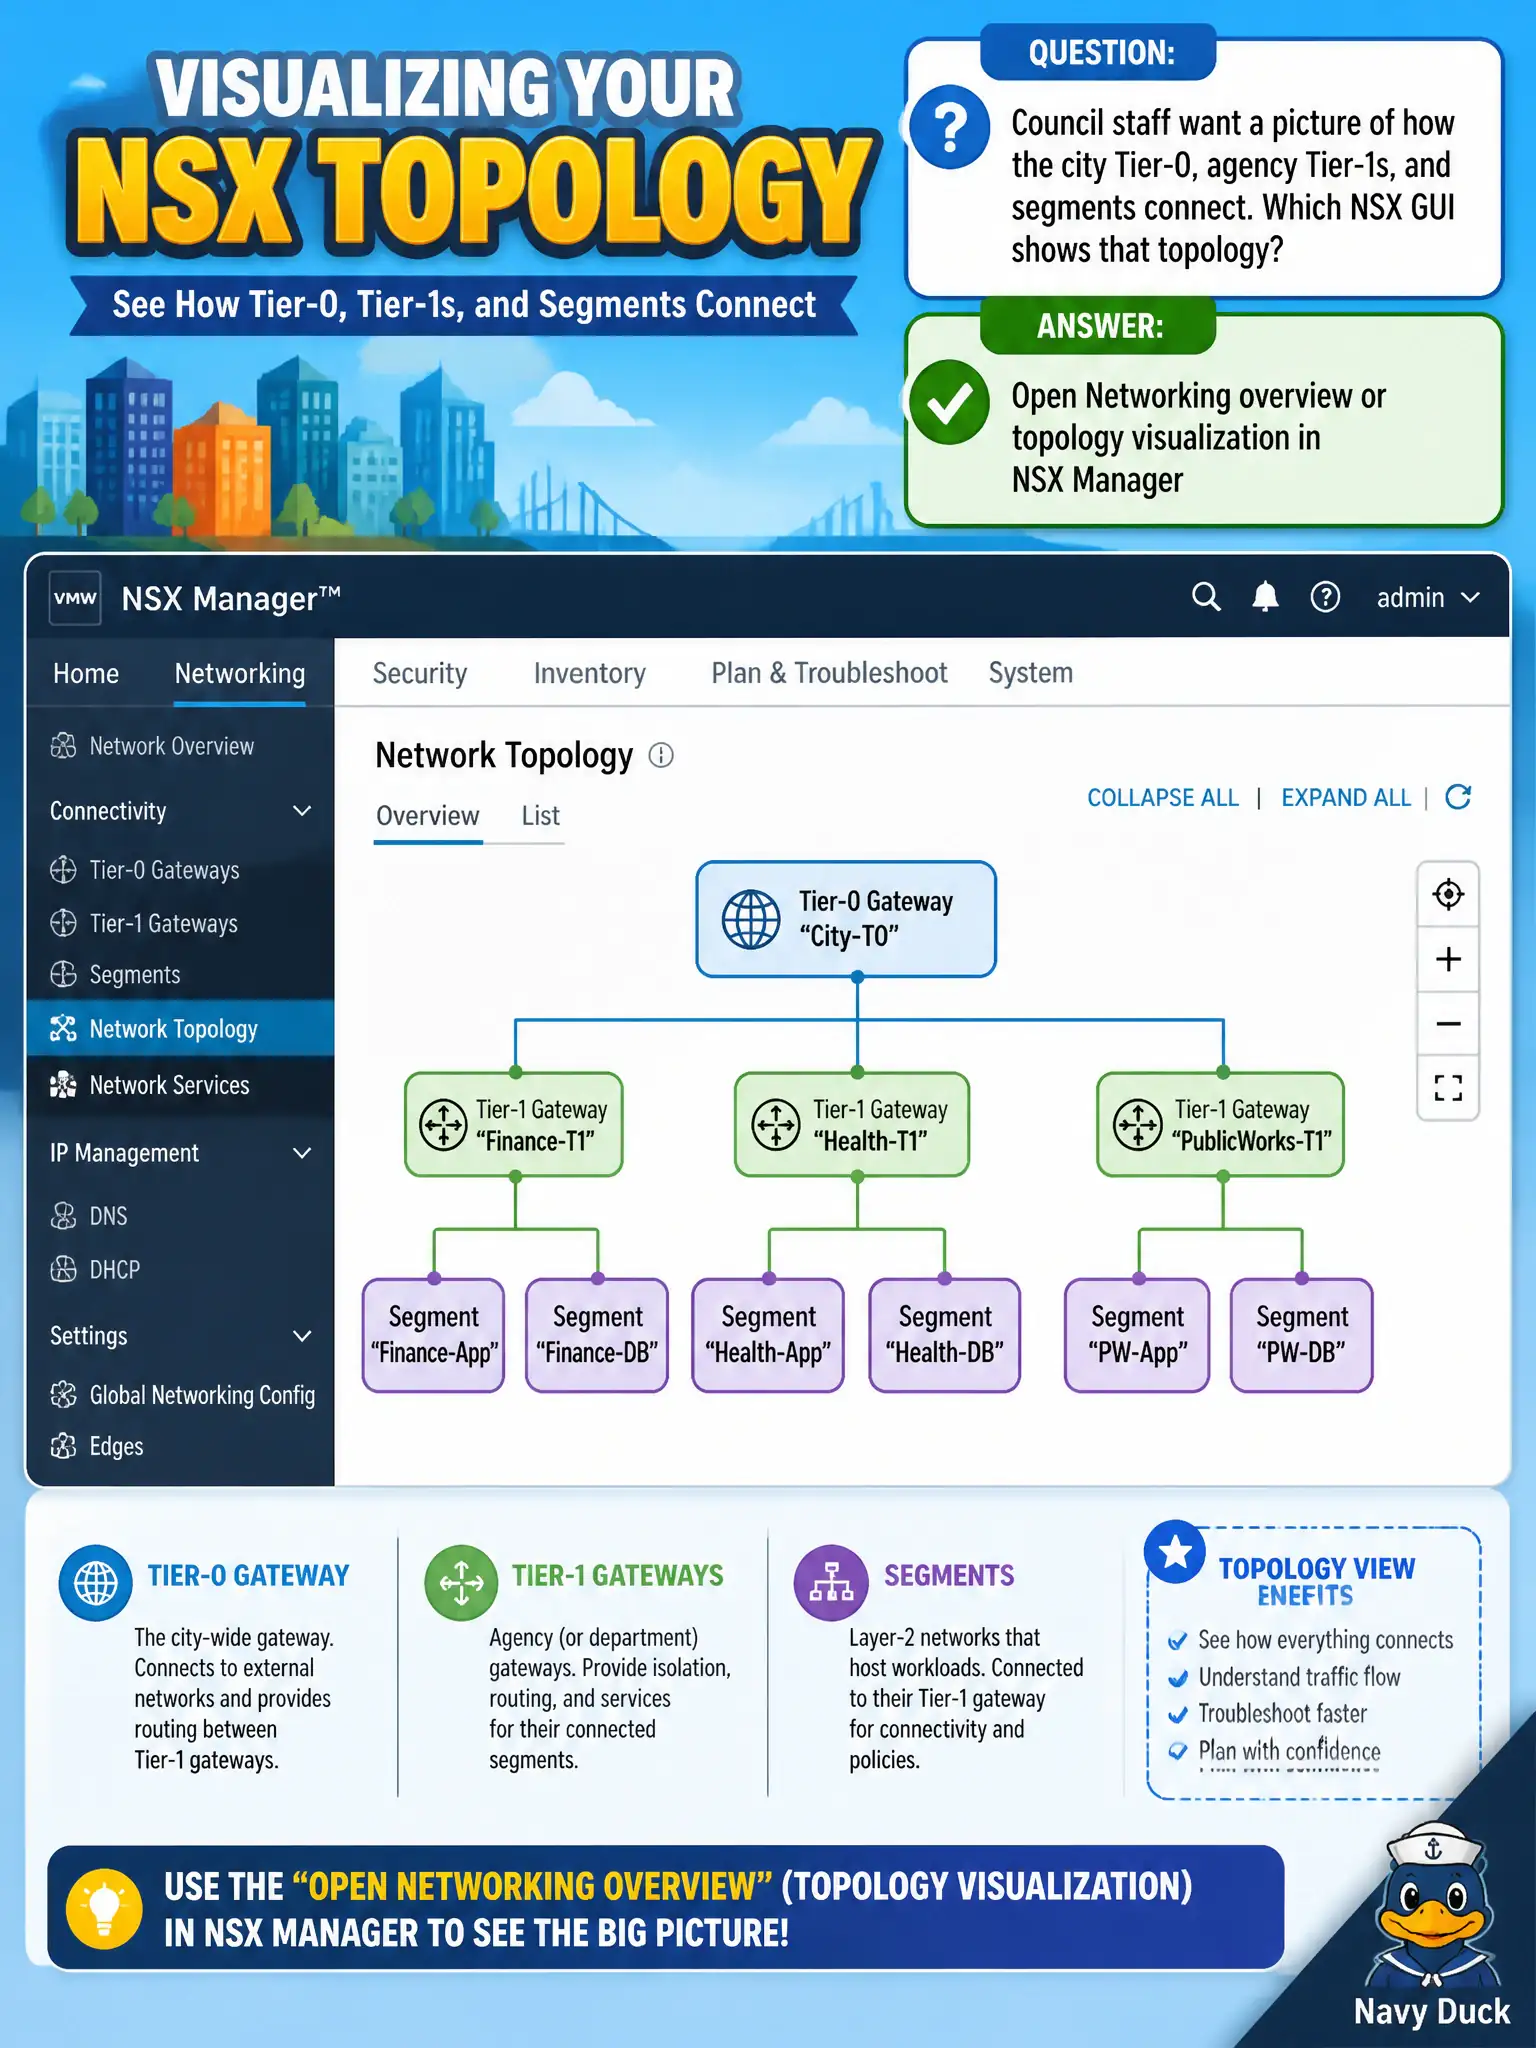
Council staff want a picture of how the city Tier-0, agency Tier-1s, and segments connect. Which NSX GUI shows that topology?
Select an answer to reveal the explanation.
Short Explanation
NSX already draws the city subway map of T0, T1, and segments under Networking overview/topology. vCenter’s host tree, Carbon Black processes, and Workspace ONE Intelligence are different maps.
Full Explanation
Council staff who want a picture of how the city Tier-0, agency Tier-1s, and segments connect should open Networking overview or topology visualization in NSX Manager—the civic subway map of gateways and segments. Using the vCenter Hosts and Clusters inventory tree shows compute hierarchy, not NSX T0–T1–segment relationships. Opening a Carbon Black process tree treats process ancestry as network topology and answers an endpoint question. Using Workspace ONE Intelligence dashboards shows EUC analytics, not NSX gateway topology. Exam caveat: topology views depend on realized objects and compute-manager sync; missing edges or segments usually mean incomplete realization, not a broken council briefing tool. Operational check: open Networking overview/topology, confirm the city Tier-0, each agency Tier-1, and key segments appear as expected, capture a screenshot for council materials, and note any unrealized objects before the briefing. In municipal operations, record the chosen control and the rejected alternatives in the change ticket so future on-call staff understand which failure modes would affect city services. Re-validate after the next maintenance window that the same GUI path and realized state still hold under the current NSX build used by the civic platform team.