
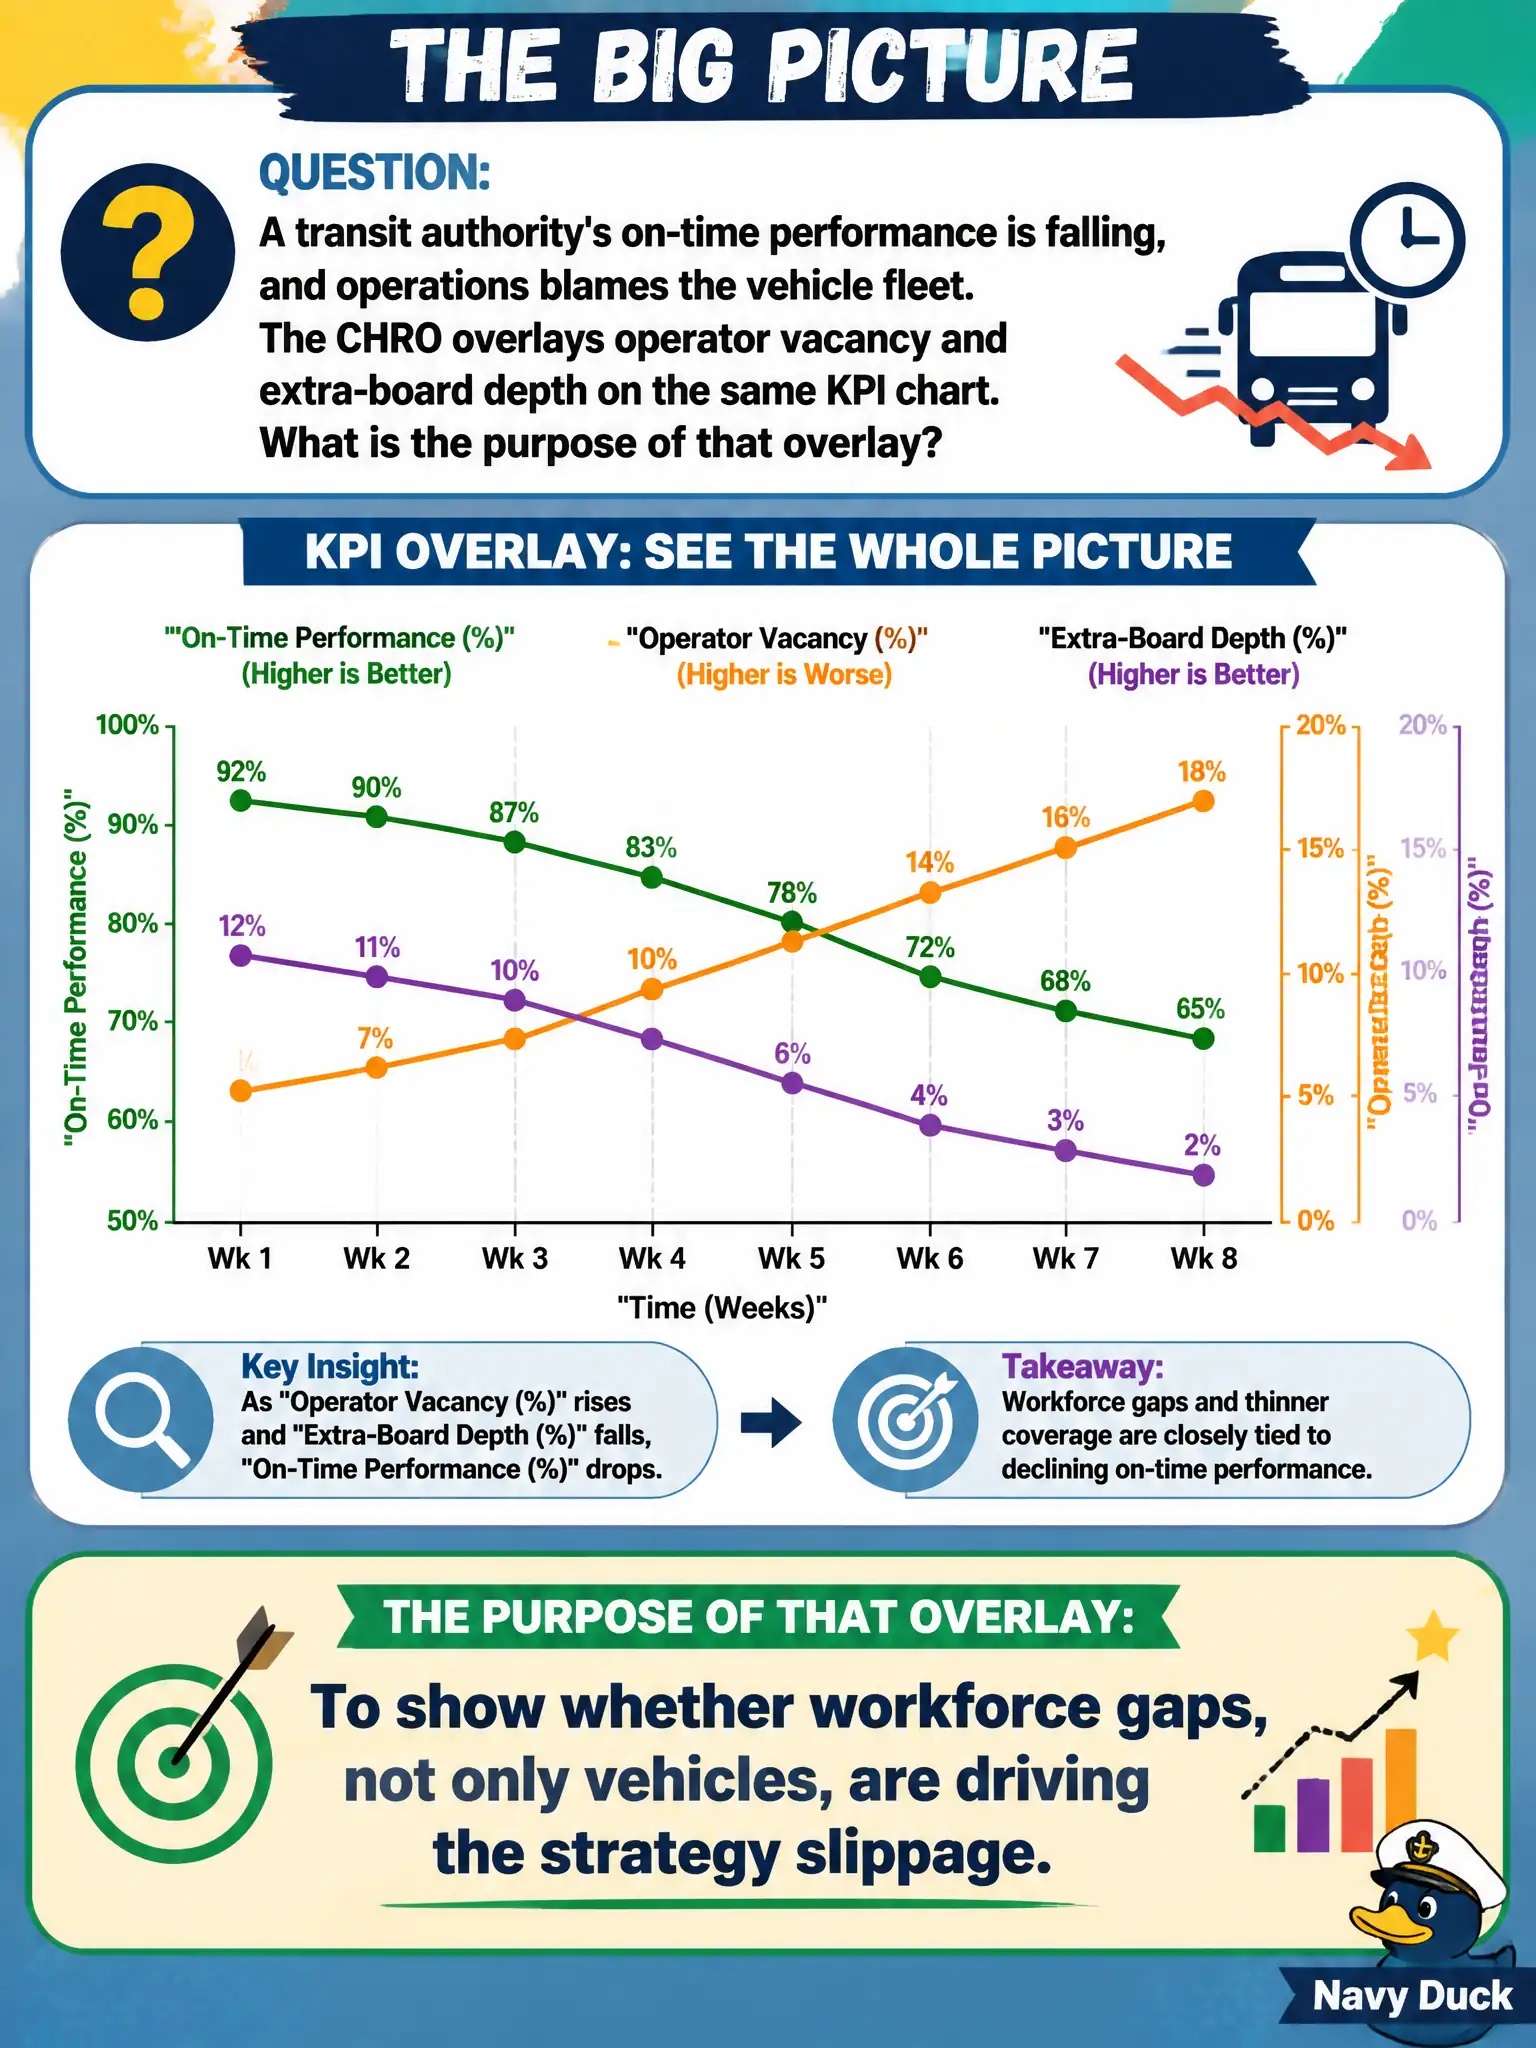
A transit authority's on-time performance is falling, and operations blames the vehicle fleet. The CHRO overlays operator vacancy and extra-board depth on the same KPI chart. What is the purpose of that overlay?
Select an answer to reveal the explanation.
Short Explanation
If buses are late, counting only broken engines is like blaming the oven when nobody showed up to bake. Extra-board depth and operator vacancies sit on the same clock as the vehicles. Overlaying those people numbers shows whether the strategy is slipping for lack of drivers, not just lack of buses.
Full Explanation
Overlaying operator vacancy and extra-board depth on the on-time performance chart is correct to show whether workforce gaps—not only vehicles—are driving strategy slippage. On-time performance is jointly produced by fleet availability and operator coverage; a single “fleet age” story misleads the transit authority’s strategy review. Proving fleet age is irrelevant and that HR metrics always outrank operations overcorrects and creates a false hierarchy. Moving on-time performance onto a recruiting dashboard alone removes it from enterprise strategy. Using the overlay only to justify overtime without examining schedulability with current operators skips redesign. Exam caveat: SPHR analytics combine people and operations indicators to diagnose strategy slippage rather than accepting a single functional narrative. Operational check: publish a joint KPI view for on-time, spare ratio, operator vacancy, and extra-board depth; assign owners for vehicle and people actions; and review them together until civic riders see restored reliability. In municipal practice, record the rationale in the recommendation packet so future leaders see why rejected options would weaken service, equity, or legal durability for residents.