
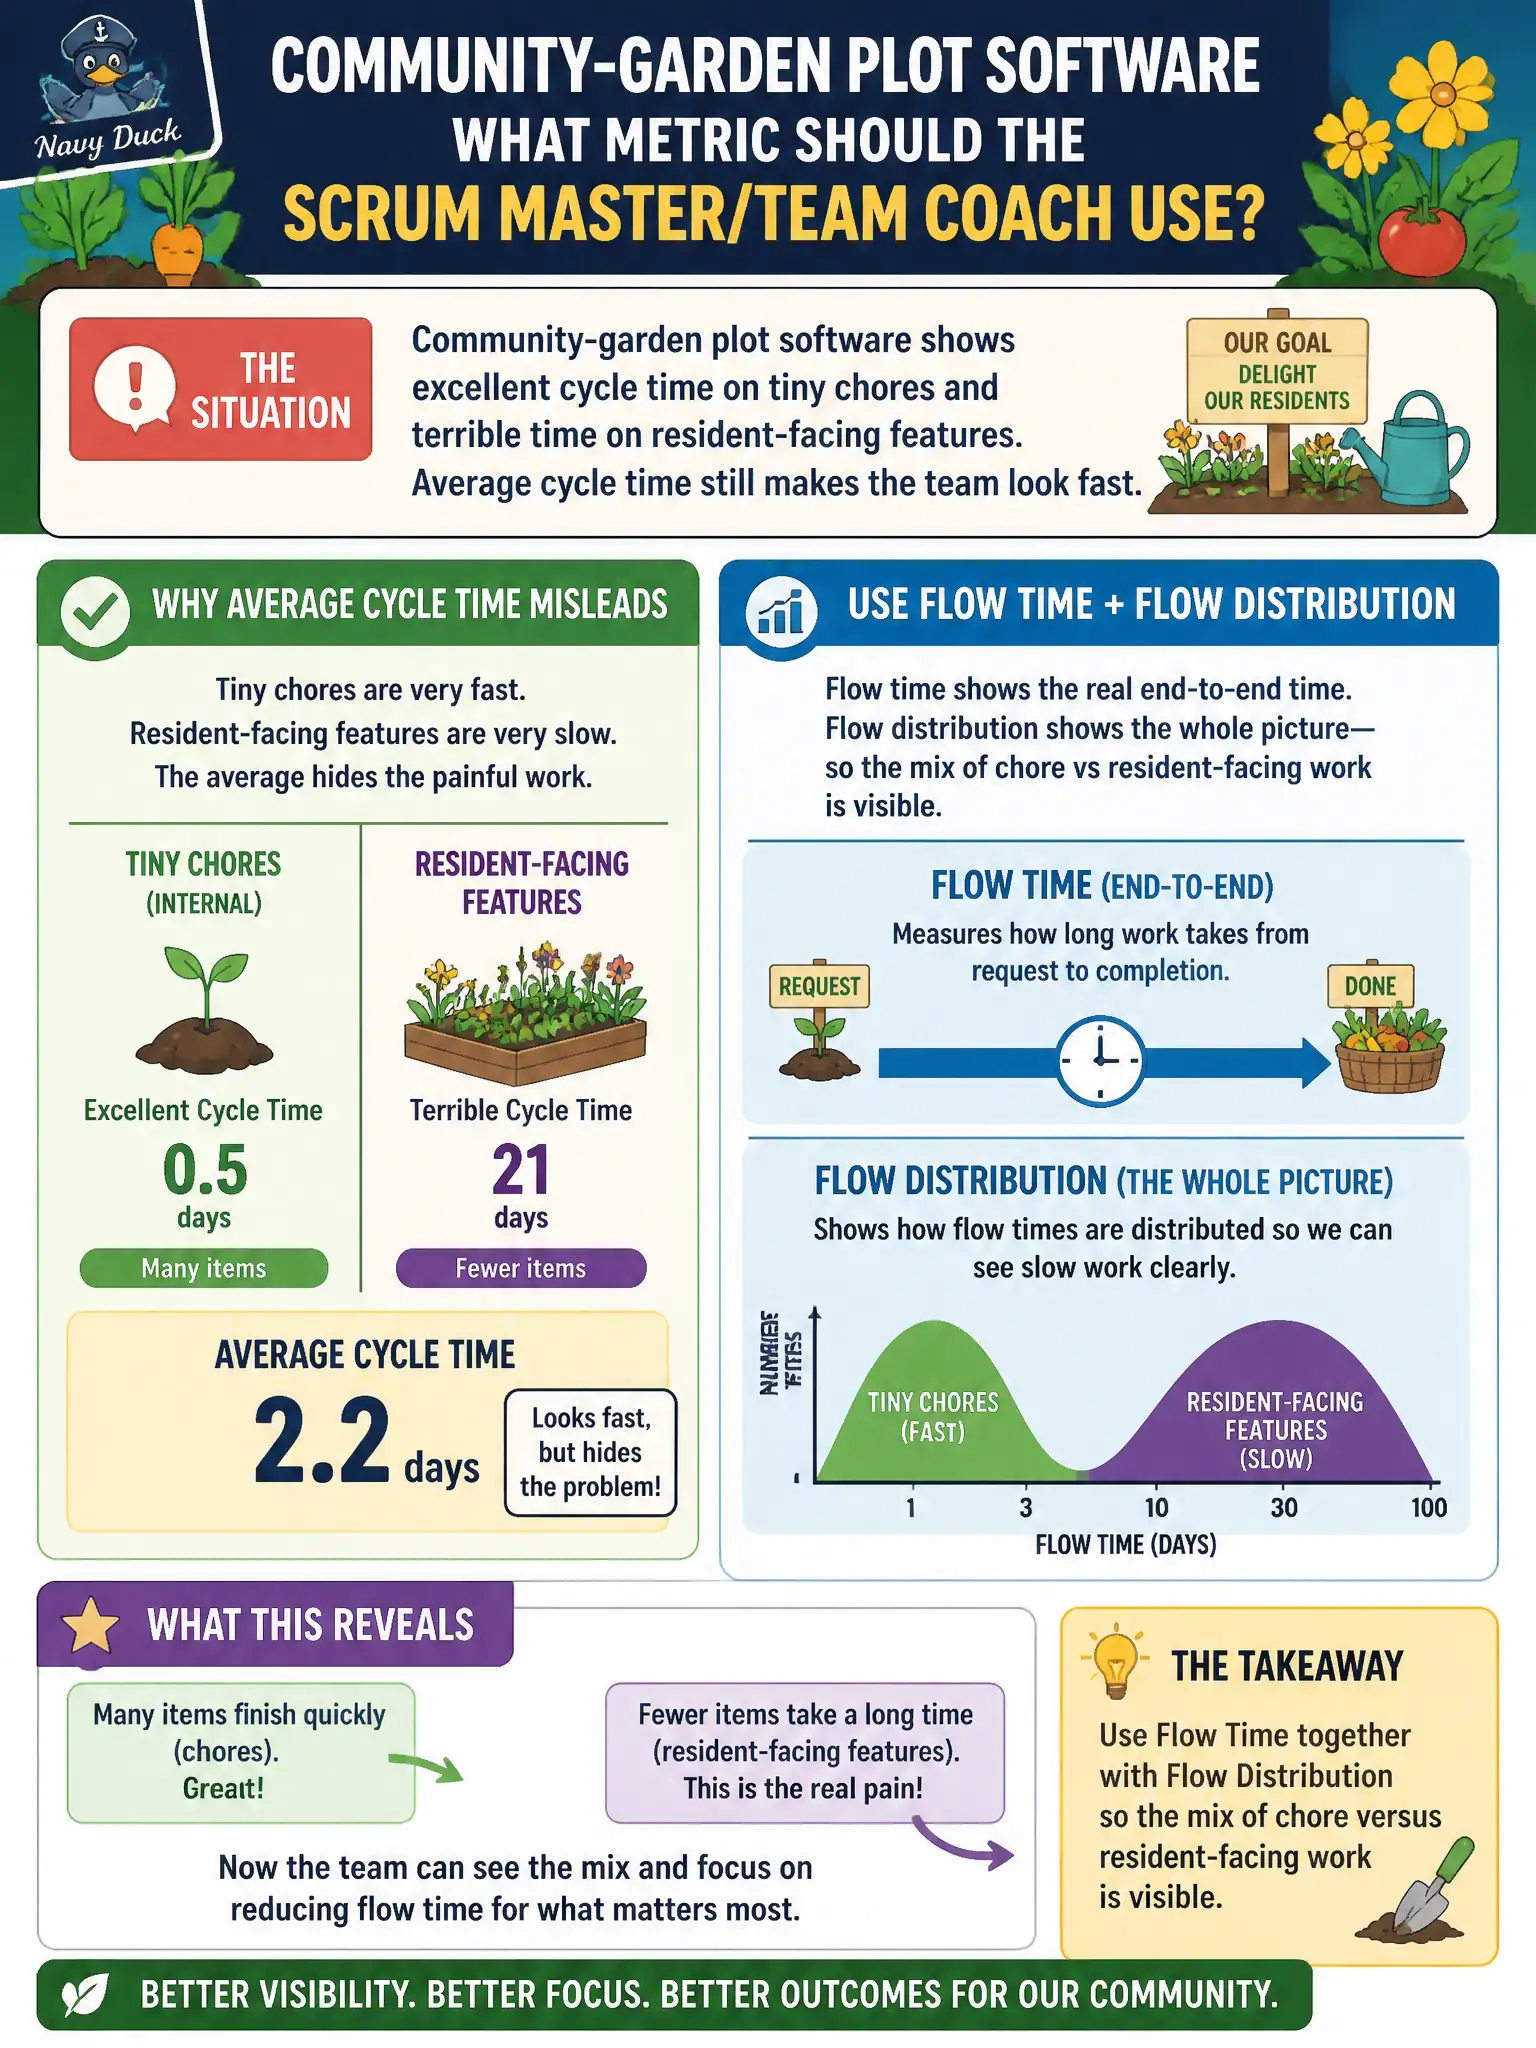
Community-garden plot software shows excellent cycle time on tiny chores and terrible time on resident-facing features. Average cycle time still makes the team look fast. What should the Scrum Master/Team Coach use?
Select an answer to reveal the explanation.
Short Explanation
If the garden crew mows paths in an hour and never finishes a plot assignment, the average still looks zippy. Mix matters. Pair flow time with distribution so resident-facing work is not drowned by tiny chores.
Full Explanation
Averages hide mix. Community-garden plot software that finishes tiny chores quickly while resident-facing features crawl can still show excellent average cycle time. The Scrum Master/Team Coach should use flow time together with flow distribution so the mix of chore versus resident-facing work stays visible and leadership cannot mistake path-mowing speed for plot-assignment delivery to the public.
Average cycle time alone fails by concept: a single number is easy and misleading when item types differ wildly. Counting chores completed while ignoring resident-facing features fails by concept by optimizing for easy throughput. Tracking individual developer hours on chores fails by concept because utilization on low-value tasks does not prove efficiency of civic garden outcomes.
Exam caveat: SAFe flow distribution (or histograms/percentile views of flow time) complements averages so coaches see skew and class-of-service effects. Segmenting by work type is often necessary for honest coaching of public-facing versus housekeeping work.
Operational check: tag garden stories as chore versus resident-facing, chart flow-time distribution by tag, share the skewed mix with the Product Owner, and rebalance pull policies so resident-facing plot features are not starved by easy chores.