
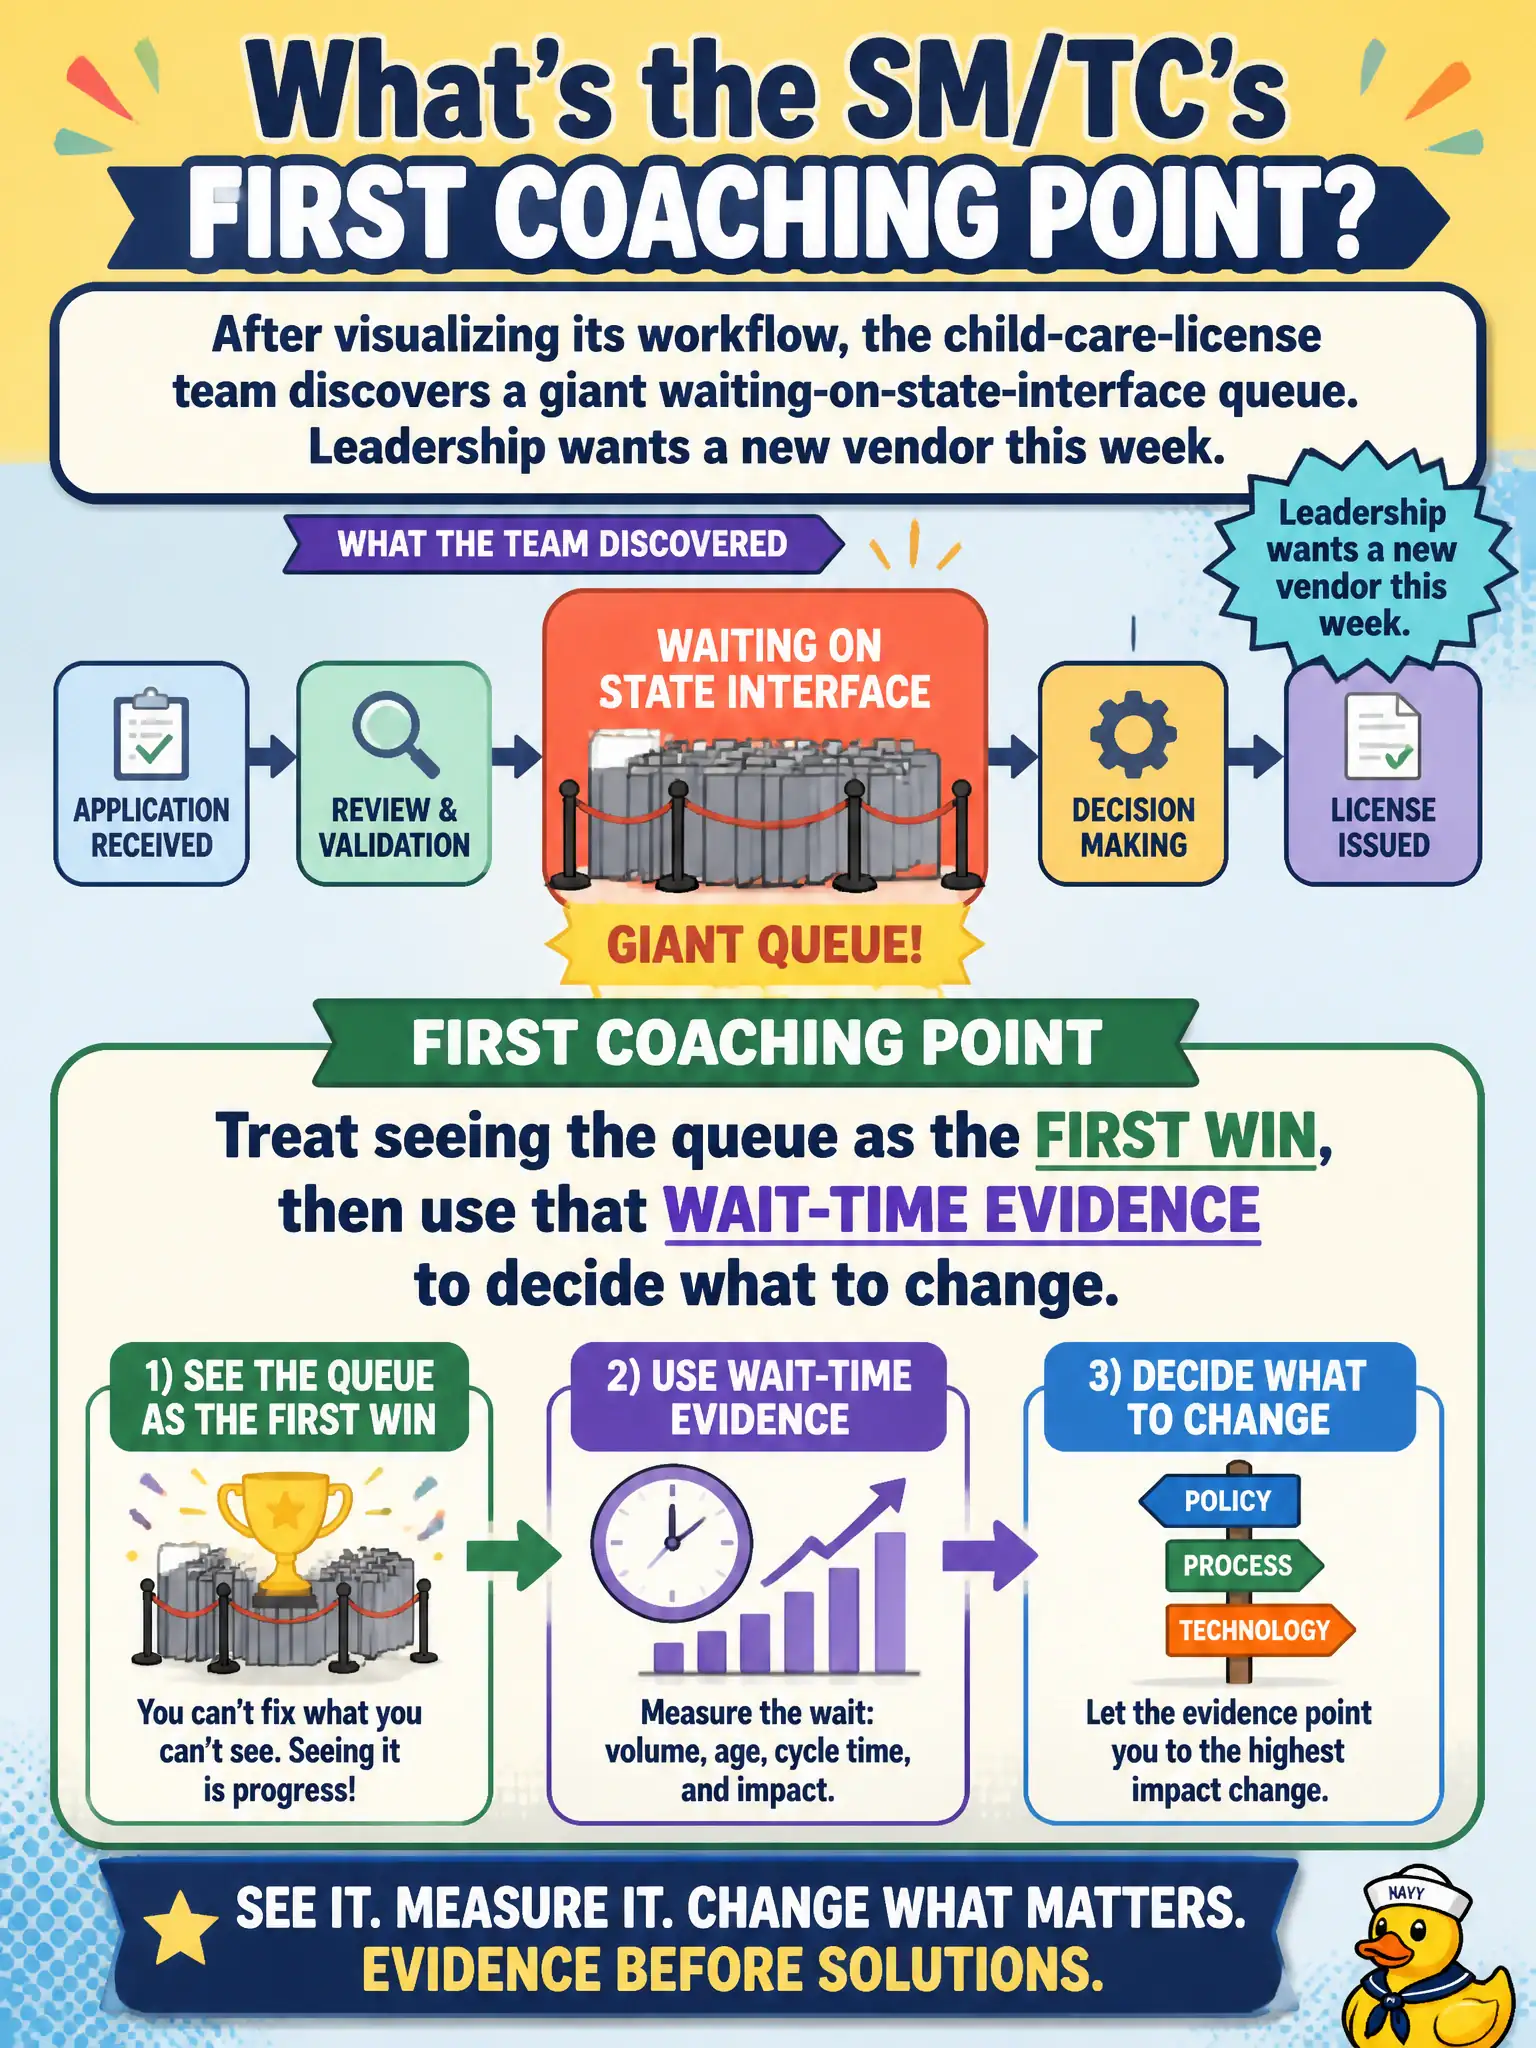
After visualizing its workflow, the child-care-license team discovers a giant waiting-on-state-interface queue. Leadership wants a new vendor this week. What is the SM/TC’s first coaching point?
Select an answer to reveal the explanation.
Short Explanation
Finding the giant waiting line is the win, not a reason to panic-buy a new vendor. Now the team can see wait time and choose an economic response. Hiding the queue or stuffing more work in just makes a longer line.
Full Explanation
When visualization first reveals a giant license or vendor queue, treat seeing the queue as the first win, then use that wait-time evidence to decide what to change. Finding the waiting line is the win, not a reason to panic-buy a new vendor. Now the team can see wait time and choose interventions with data instead of anecdotes.
Signing a replacement vendor before measuring wait time fails because procurement panic skips diagnosis. Hiding the queue column so the PI forecast stays optimistic fails because optimistic lies destroy trust and learning. Starting more license stories upstream so the queue looks busy rather than stuck fails because flooding a bottleneck worsens delay.
Exam caveat: transparency precedes optimization; do not shoot the messenger column. Operational check: keep the queue visible, measure wait time and arrival/departure rates, pick experiments (policies, batch size, staffing, vendor process) from that evidence, and revisit forecasts with honest queue data. Wait-time evidence turns emotional vendor debates into measurable experiments the ART can fund or reject rationally. Wait-time evidence turns emotional vendor debates into measurable experiments the ART can fund or reject rationally.