
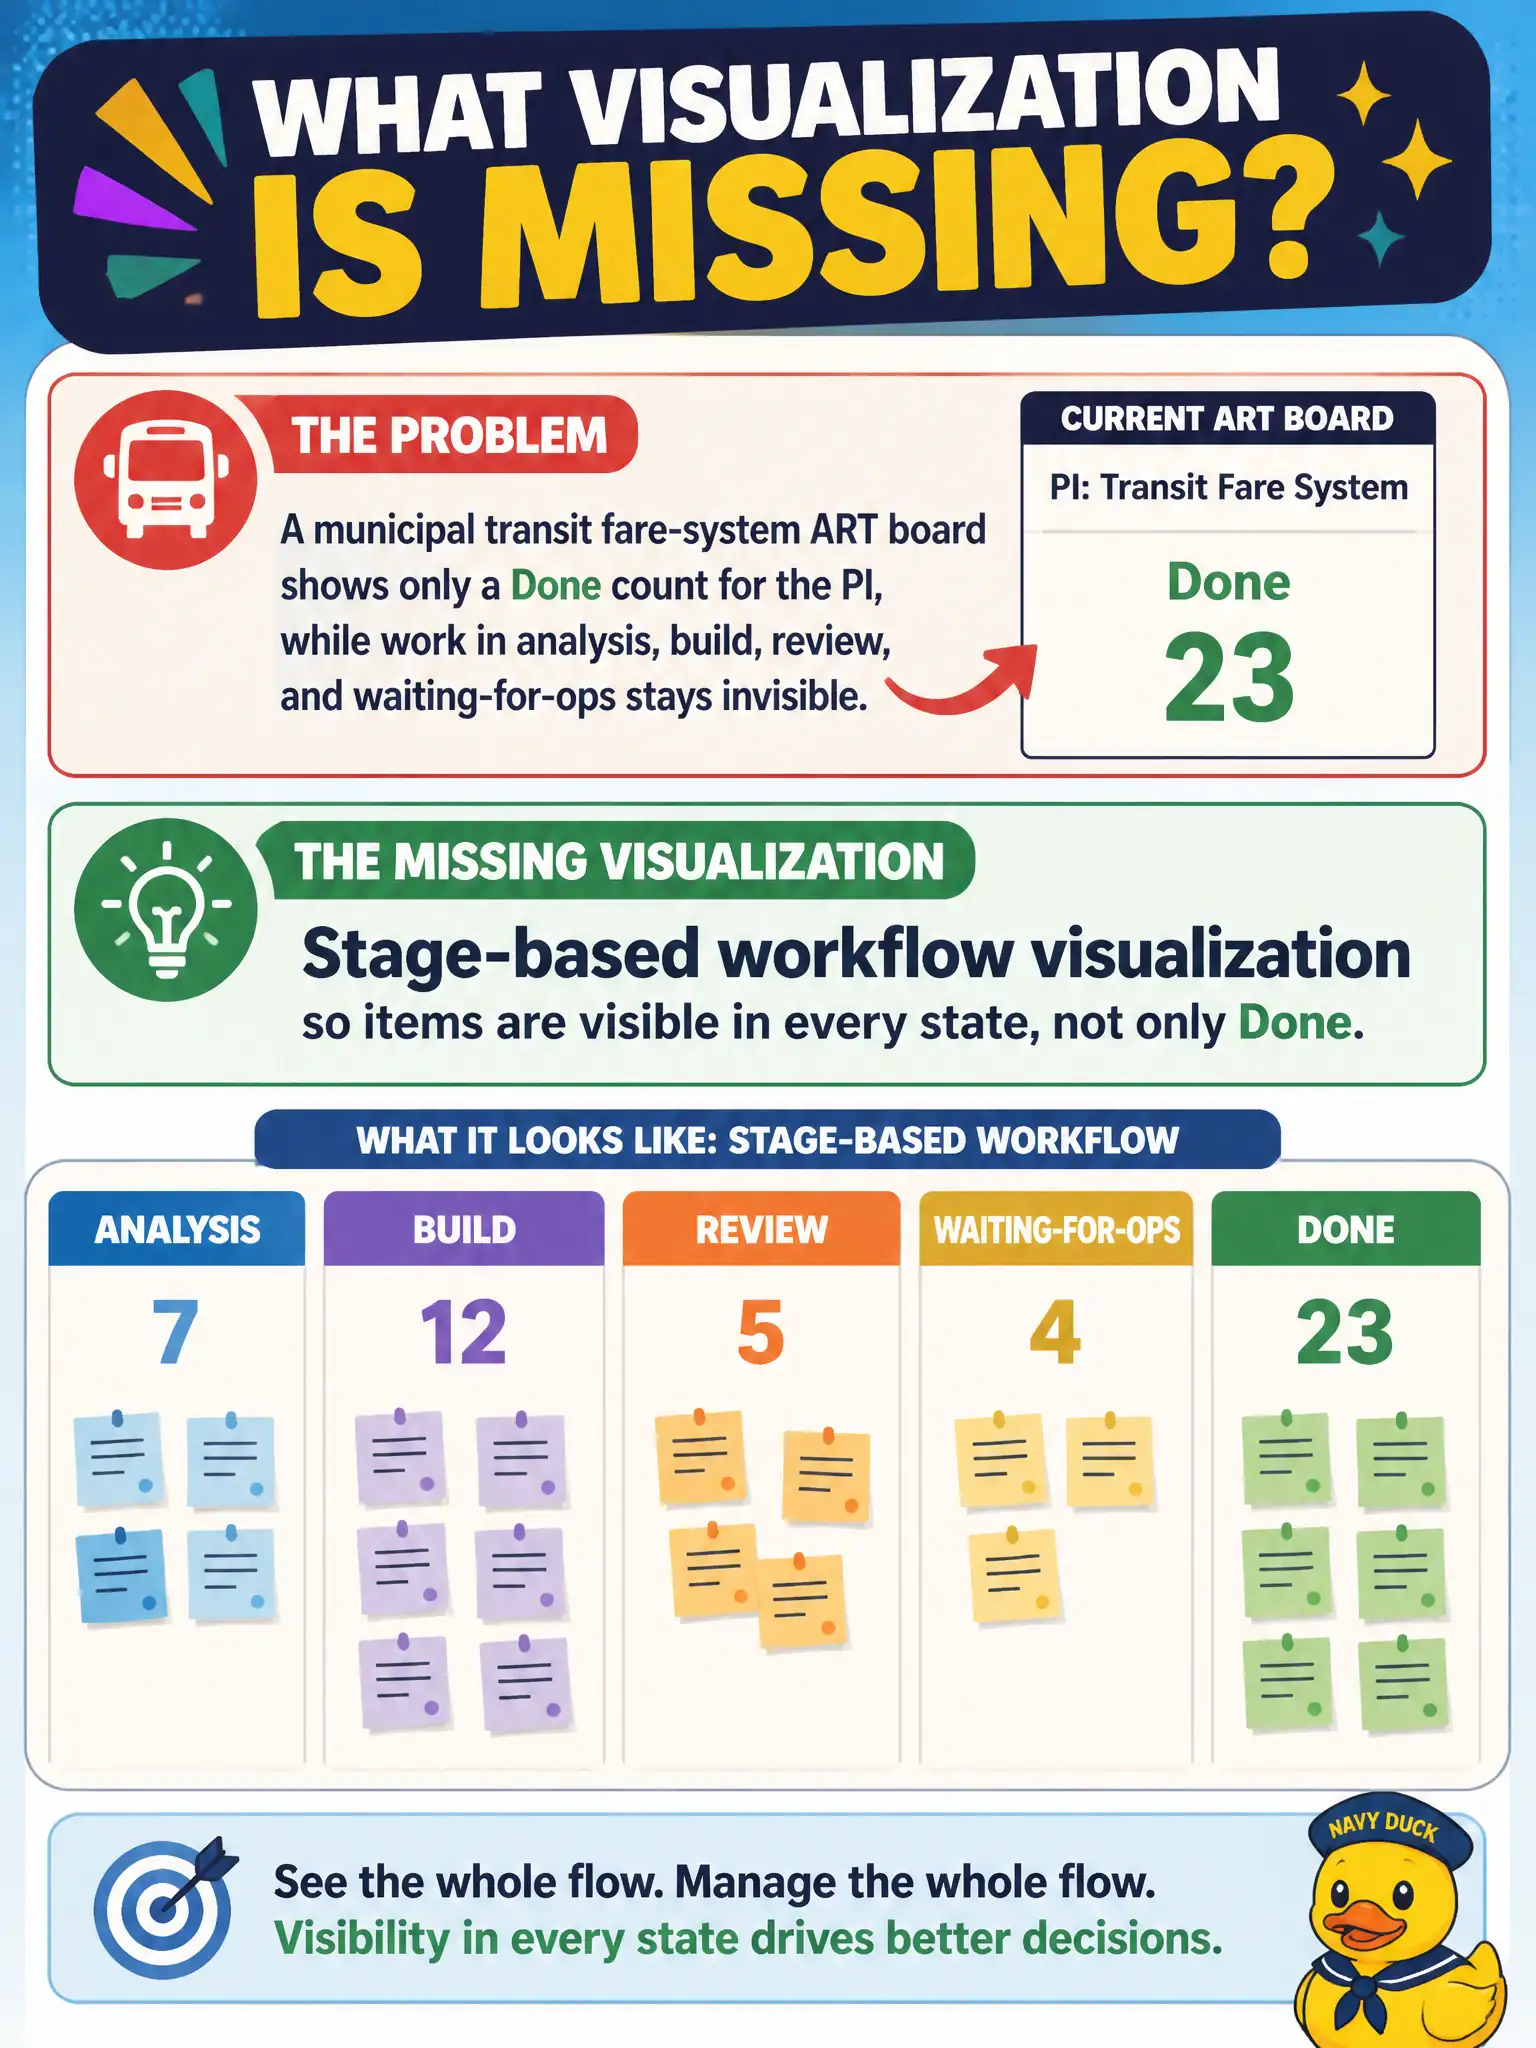
A municipal transit fare-system ART board shows only a Done count for the PI, while work in analysis, build, review, and waiting-for-ops stays invisible. What visualization is missing?
Select an answer to reveal the explanation.
Short Explanation
A Done counter is the scoreboard after the game. Transit fare work spends most of its life in the middle of the field. Show the stages or you will only celebrate finishes you cannot predict.
Full Explanation
Flow visualization must show items in every workflow state—analysis, build, review, waiting-for-ops—not only a Done count. When a municipal transit fare-system board shows only Done for the PI, stage-based workflow visualization is missing and queues stay hidden from riders and operations partners. Enlarging the Done number font so stakeholders feel progress faster is cosmetic and changes nothing about stalled fare work. A monthly trophy for the highest Done count rewards local optimization and encourages teams to close the wrong work early. A burn-up of closed tickets with no workflow states still hides where fare items stall in waiting-for-ops or review. Exam caveat: Done remains important; the point is that Done without in-state visibility cannot explain delays riders and ops feel. Operational check: add columns or swimlanes for each fare-system state and walk non-Done queues in ART sync until waiting-for-ops shrinks. Review non-Done queues with operations partners until waiting-for-ops shrinks for rider-facing fare items. Transit fare work stalled in waiting-for-ops still affects riders even when Done counts look healthy; stage visibility exposes that civic delay and keeps Business Owners honest about service risk.