
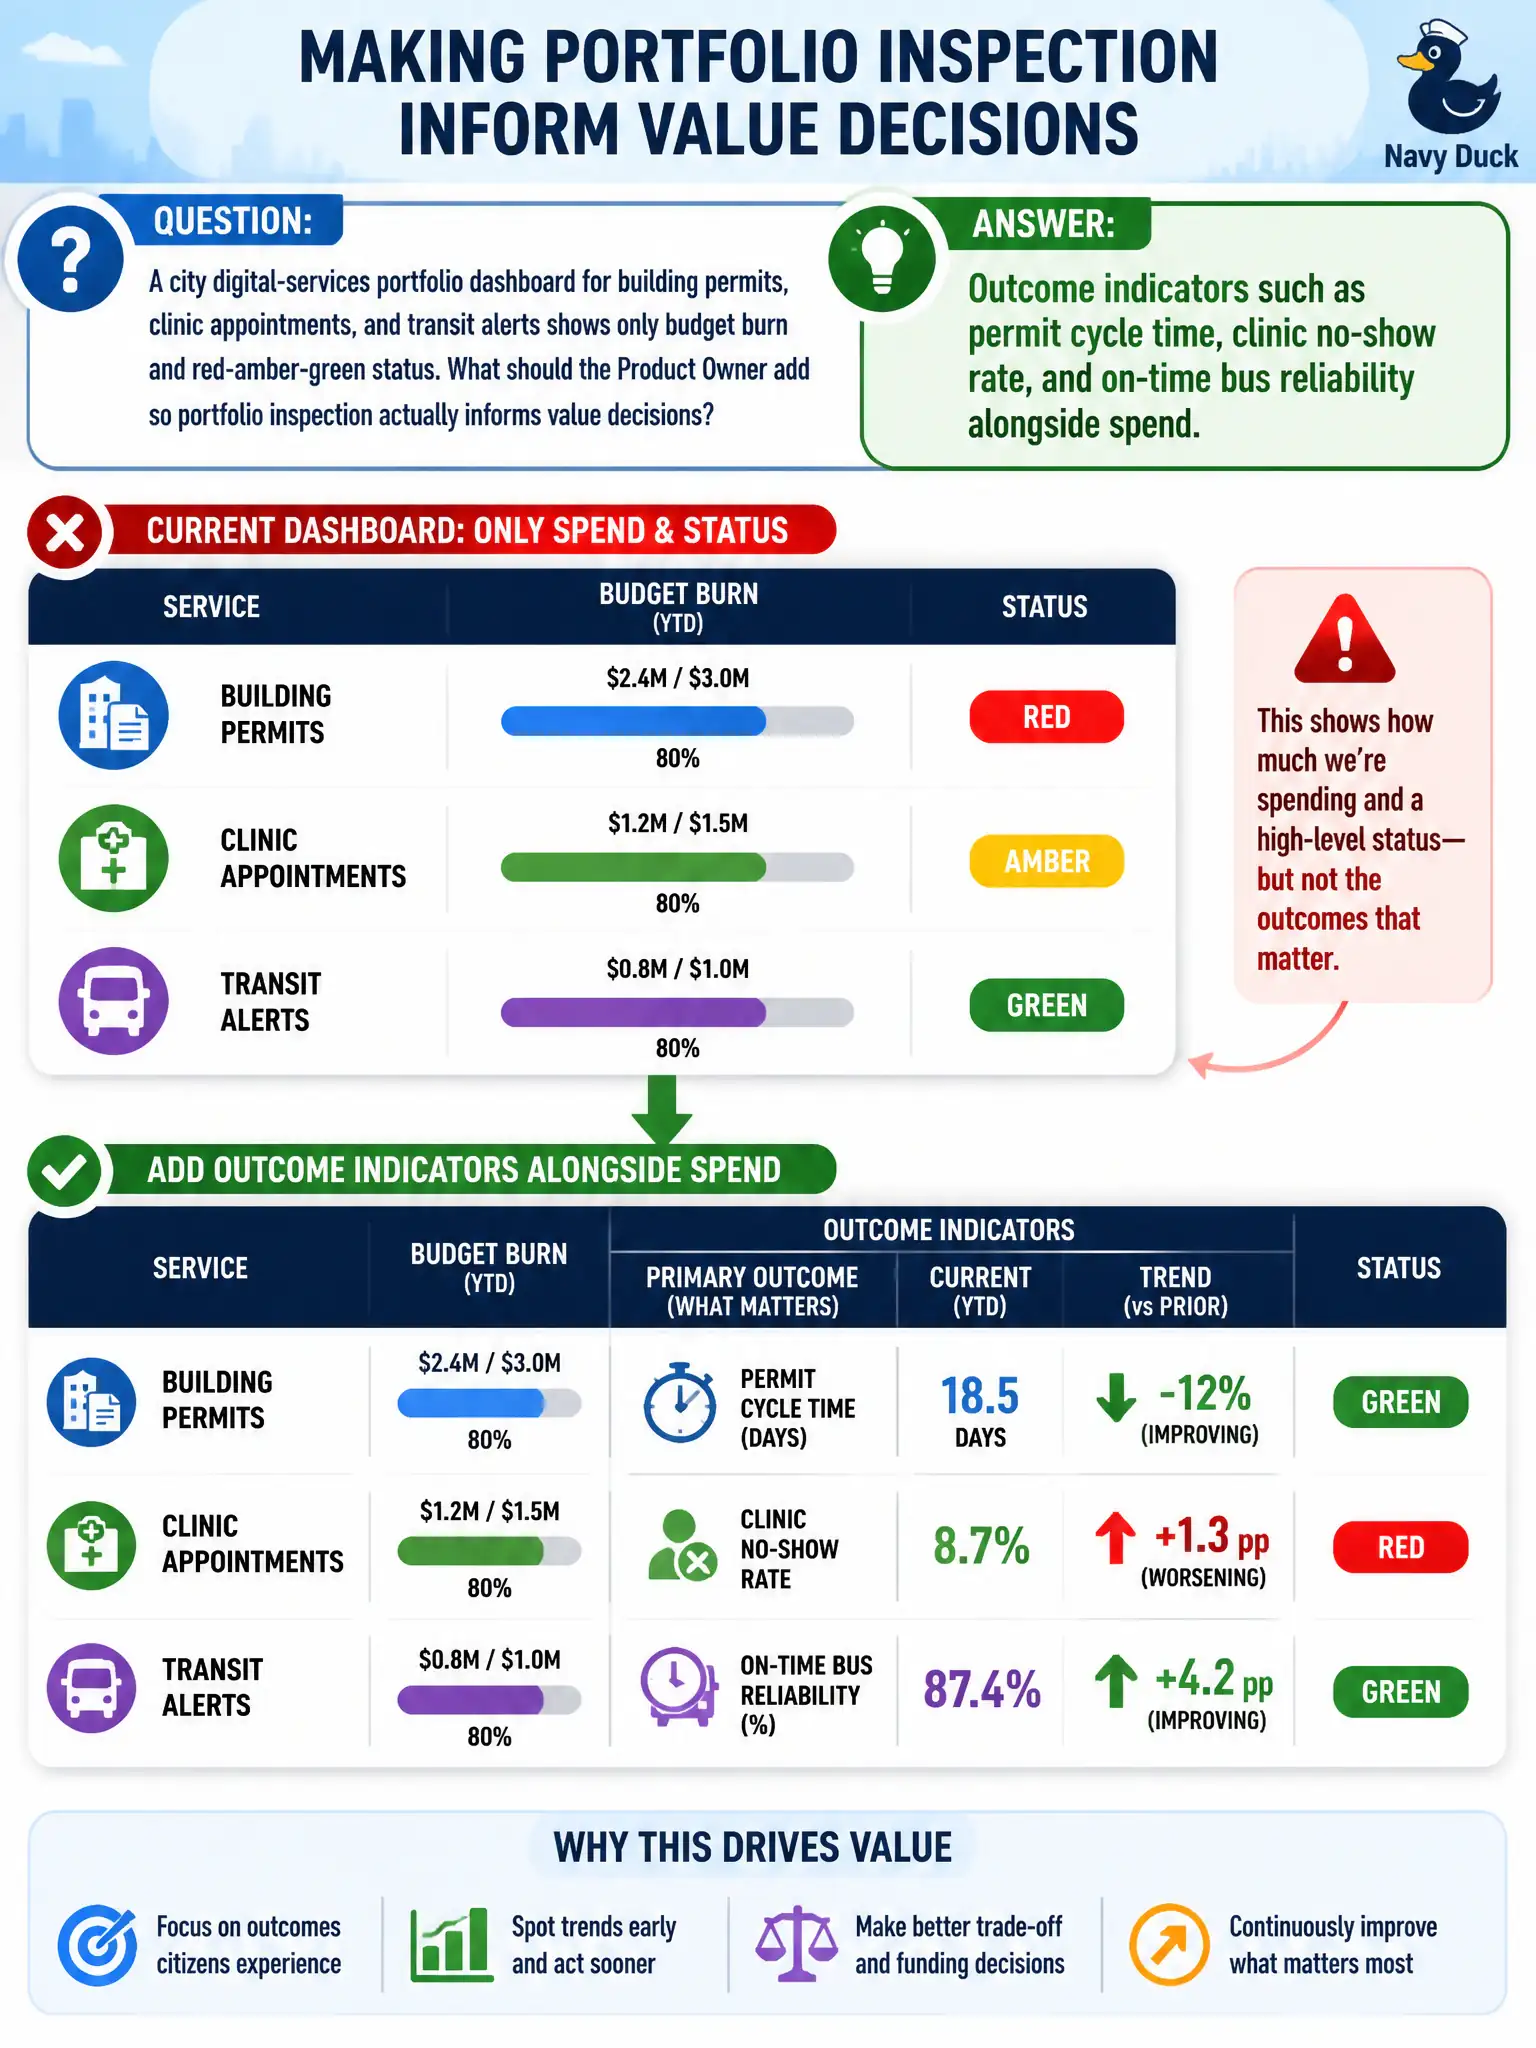
A city digital-services portfolio dashboard for building permits, clinic appointments, and transit alerts shows only budget burn and red-amber-green status. What should the Product Owner add so portfolio inspection actually informs value decisions?
Select an answer to reveal the explanation.
Short Explanation
A dashboard that only shows money and traffic-light colors is like a car dash with a fuel gauge and a check-engine light but no speed or destination. City leaders still cannot see whether permits are faster or buses are on time. Outcome measures turn the conversation from "are we spending" into "are residents better off."
Full Explanation
Agile portfolio transparency exists so leadership can inspect whether investments produce outcomes, not merely whether money is consumed on schedule. When a city digital-services dashboard for building permits, clinic appointments, and transit alerts shows only budget burn and red-amber-green status, leaders still cannot see whether residents are better off. Adding outcome indicators such as permit cycle time, clinic no-show rate, and on-time bus reliability alongside spend lets the portfolio reallocate toward products that move citizen results. Velocity roll-ups and composite RAG scores optimize reporting theater rather than value.
A weekly story-point velocity roll-up for every Scrum Team fails because throughput comparisons are not citizen outcomes. A Gantt of remaining project phases so RAG derives from schedule variance fails by centering predictive variance over results. A single composite RAG that weights finance more heavily than delivery risk fails by collapsing insight into a finance-tilted traffic light.
Exam caveat: Portfolio dashboards need outcome indicators beside spend, not RAG-and-burn alone. Operational check: Add permit cycle time, clinic no-show rate, and bus on-time reliability to the portfolio dashboard next to budget burn, and review those outcomes when reallocating capacity.