
Parks needs to profile why fountain asset loads stall the plaza twin. Which instrumentation pair is appropriate?
Select an answer to reveal the explanation.
Short Explanation
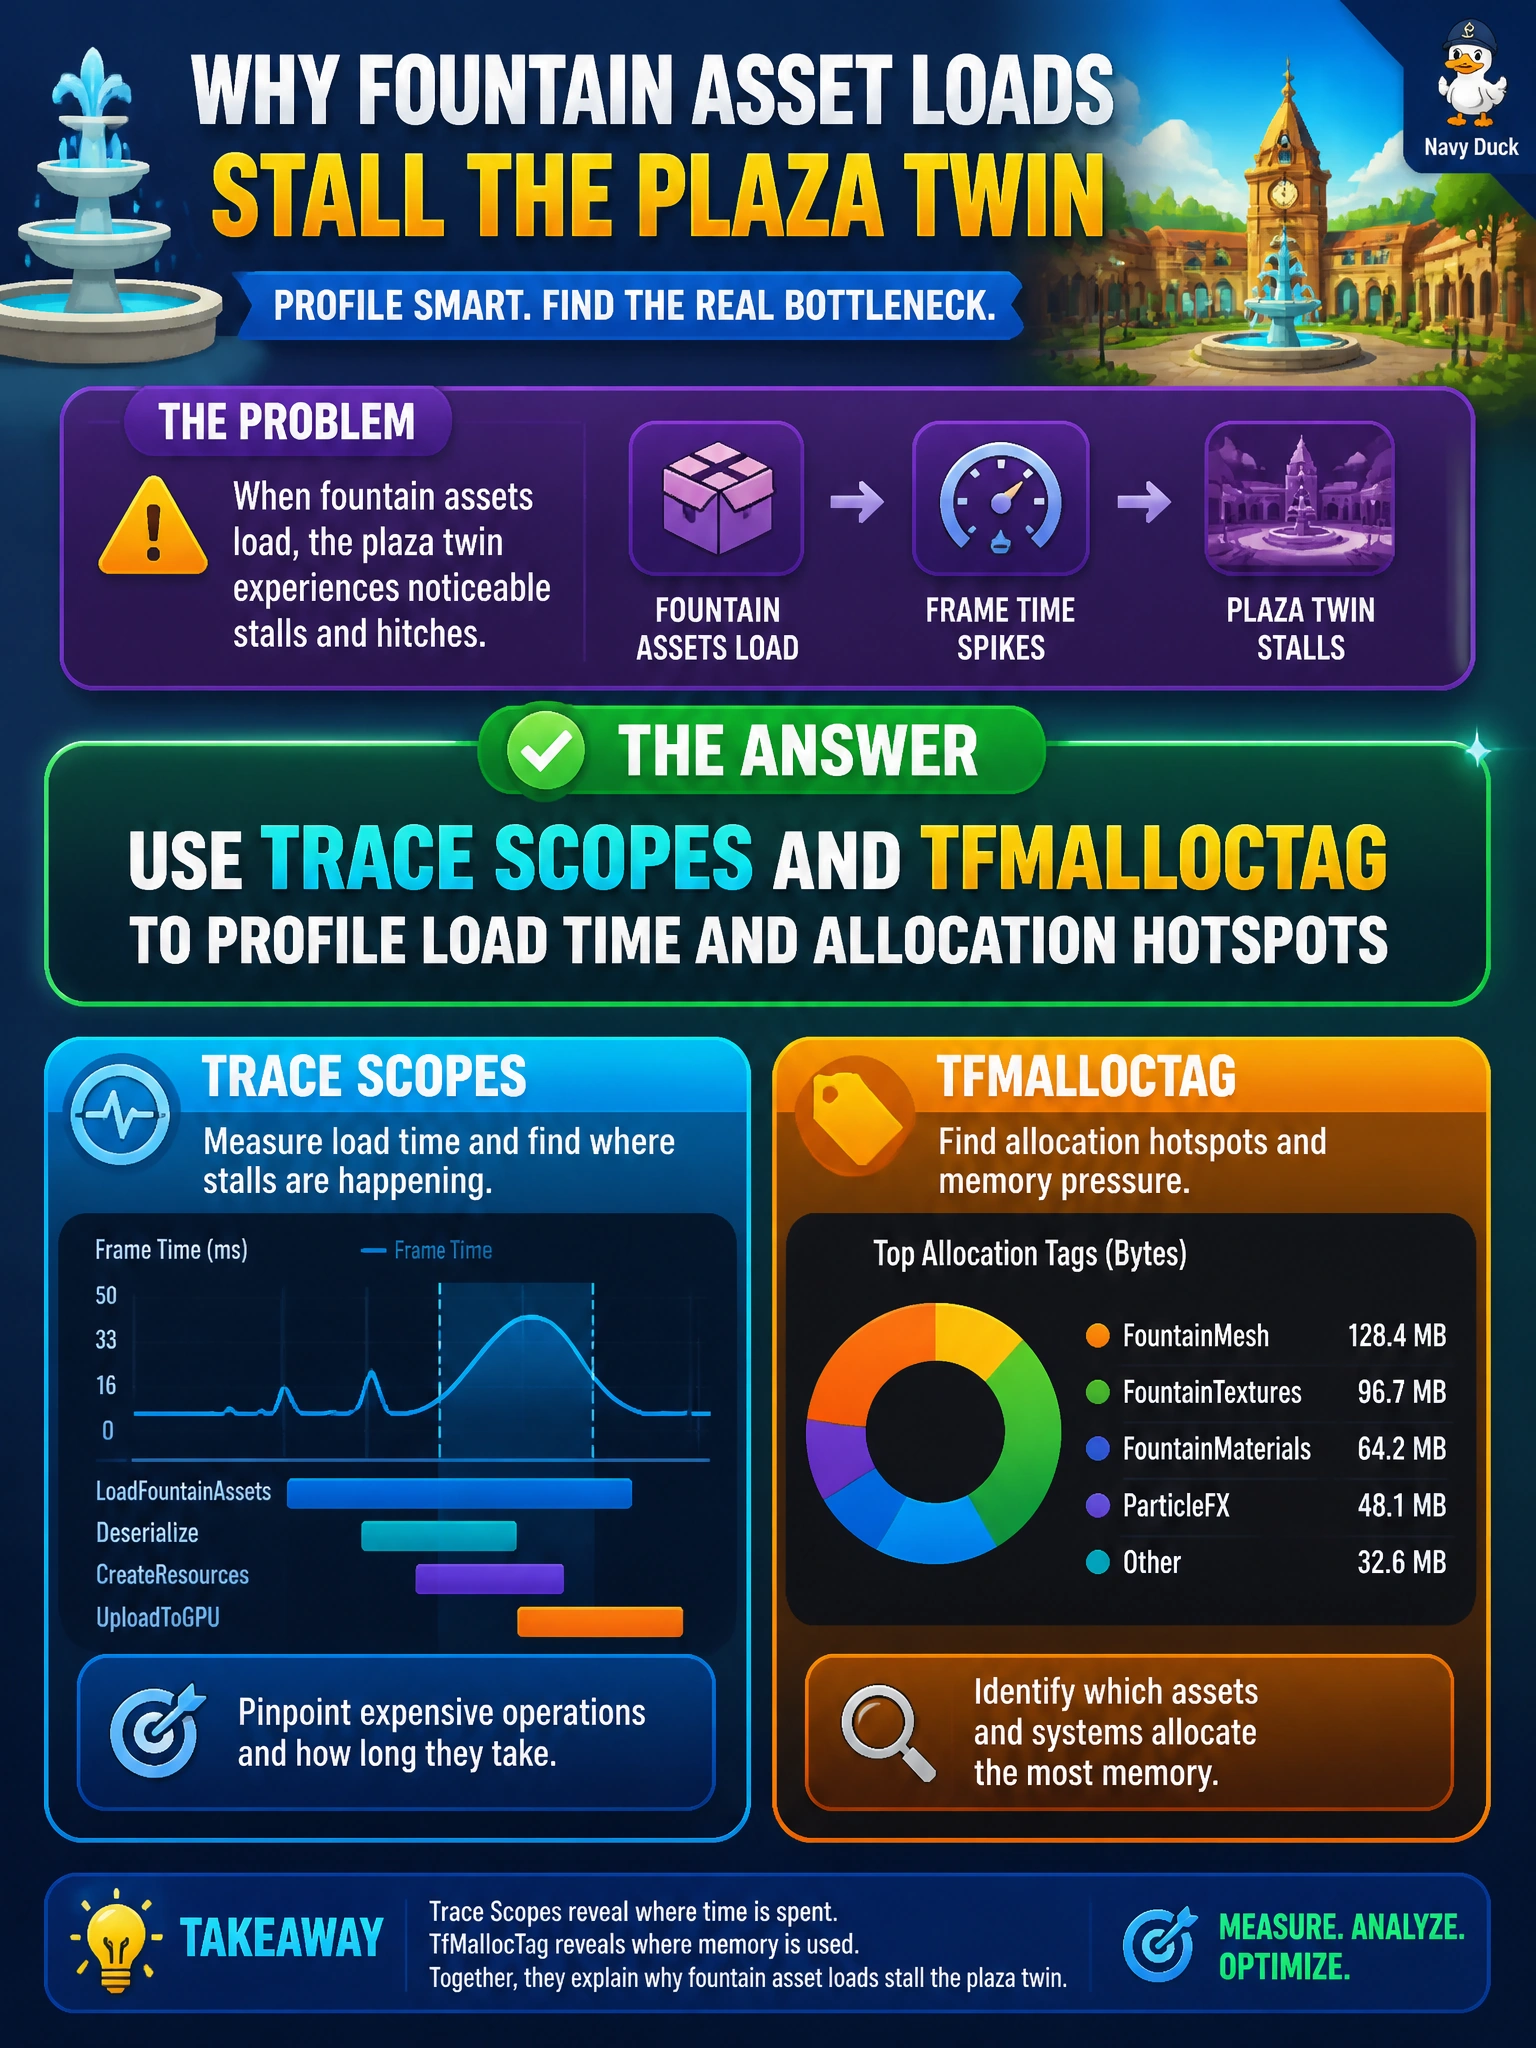
Slow fountains need Trace and malloc tags, not a screenshot or deleted materials. Profile the load path so you know where time and memory go.
Full Explanation
Parks profiling of fountain asset loads that stall the plaza twin should use Trace scopes together with TfMallocTag to capture both wall-clock/load timing and allocation hotspots along the USD-aware load path. Trace scopes mark timed regions (open, compose, payload load, material bind), while TfMallocTag attributes heap growth to tagged subsystems—together they show whether the stall is I/O, composition, geometry inflation, or allocator churn rather than guessing from a still image.
Replacing profiling with a one-time visual screenshot of the fountain fails by concept: a screenshot shows final pixels, not where time or memory was spent during load. Deleting all materials so load timing becomes irrelevant fails because stripping content changes the workload and can mask the real hotspot instead of measuring it. Storing malloc counters only in undocumented USDA comments fails because comments are not live instrumentation; they neither sample allocations at runtime nor integrate with Trace timelines operators can act on.
Exam caveat: candidates confuse “looks slow” anecdotal evidence or destructive content deletion with actual USD profiling APIs. Operational check: wrap fountain load/open paths in Trace scopes, enable TfMallocTag for the run, load the plaza twin under representative conditions, identify the hottest scopes and allocation tags, then optimize or defer that specific path (payload, resolver, mesh) and re-profile to confirm improvement without deleting materials or relying on screenshots.