
Assessor multi-GPU throughput halves while fabric manager reports partial NVSwitch links down. What should ops interpret?
Select an answer to reveal the explanation.
Short Explanation
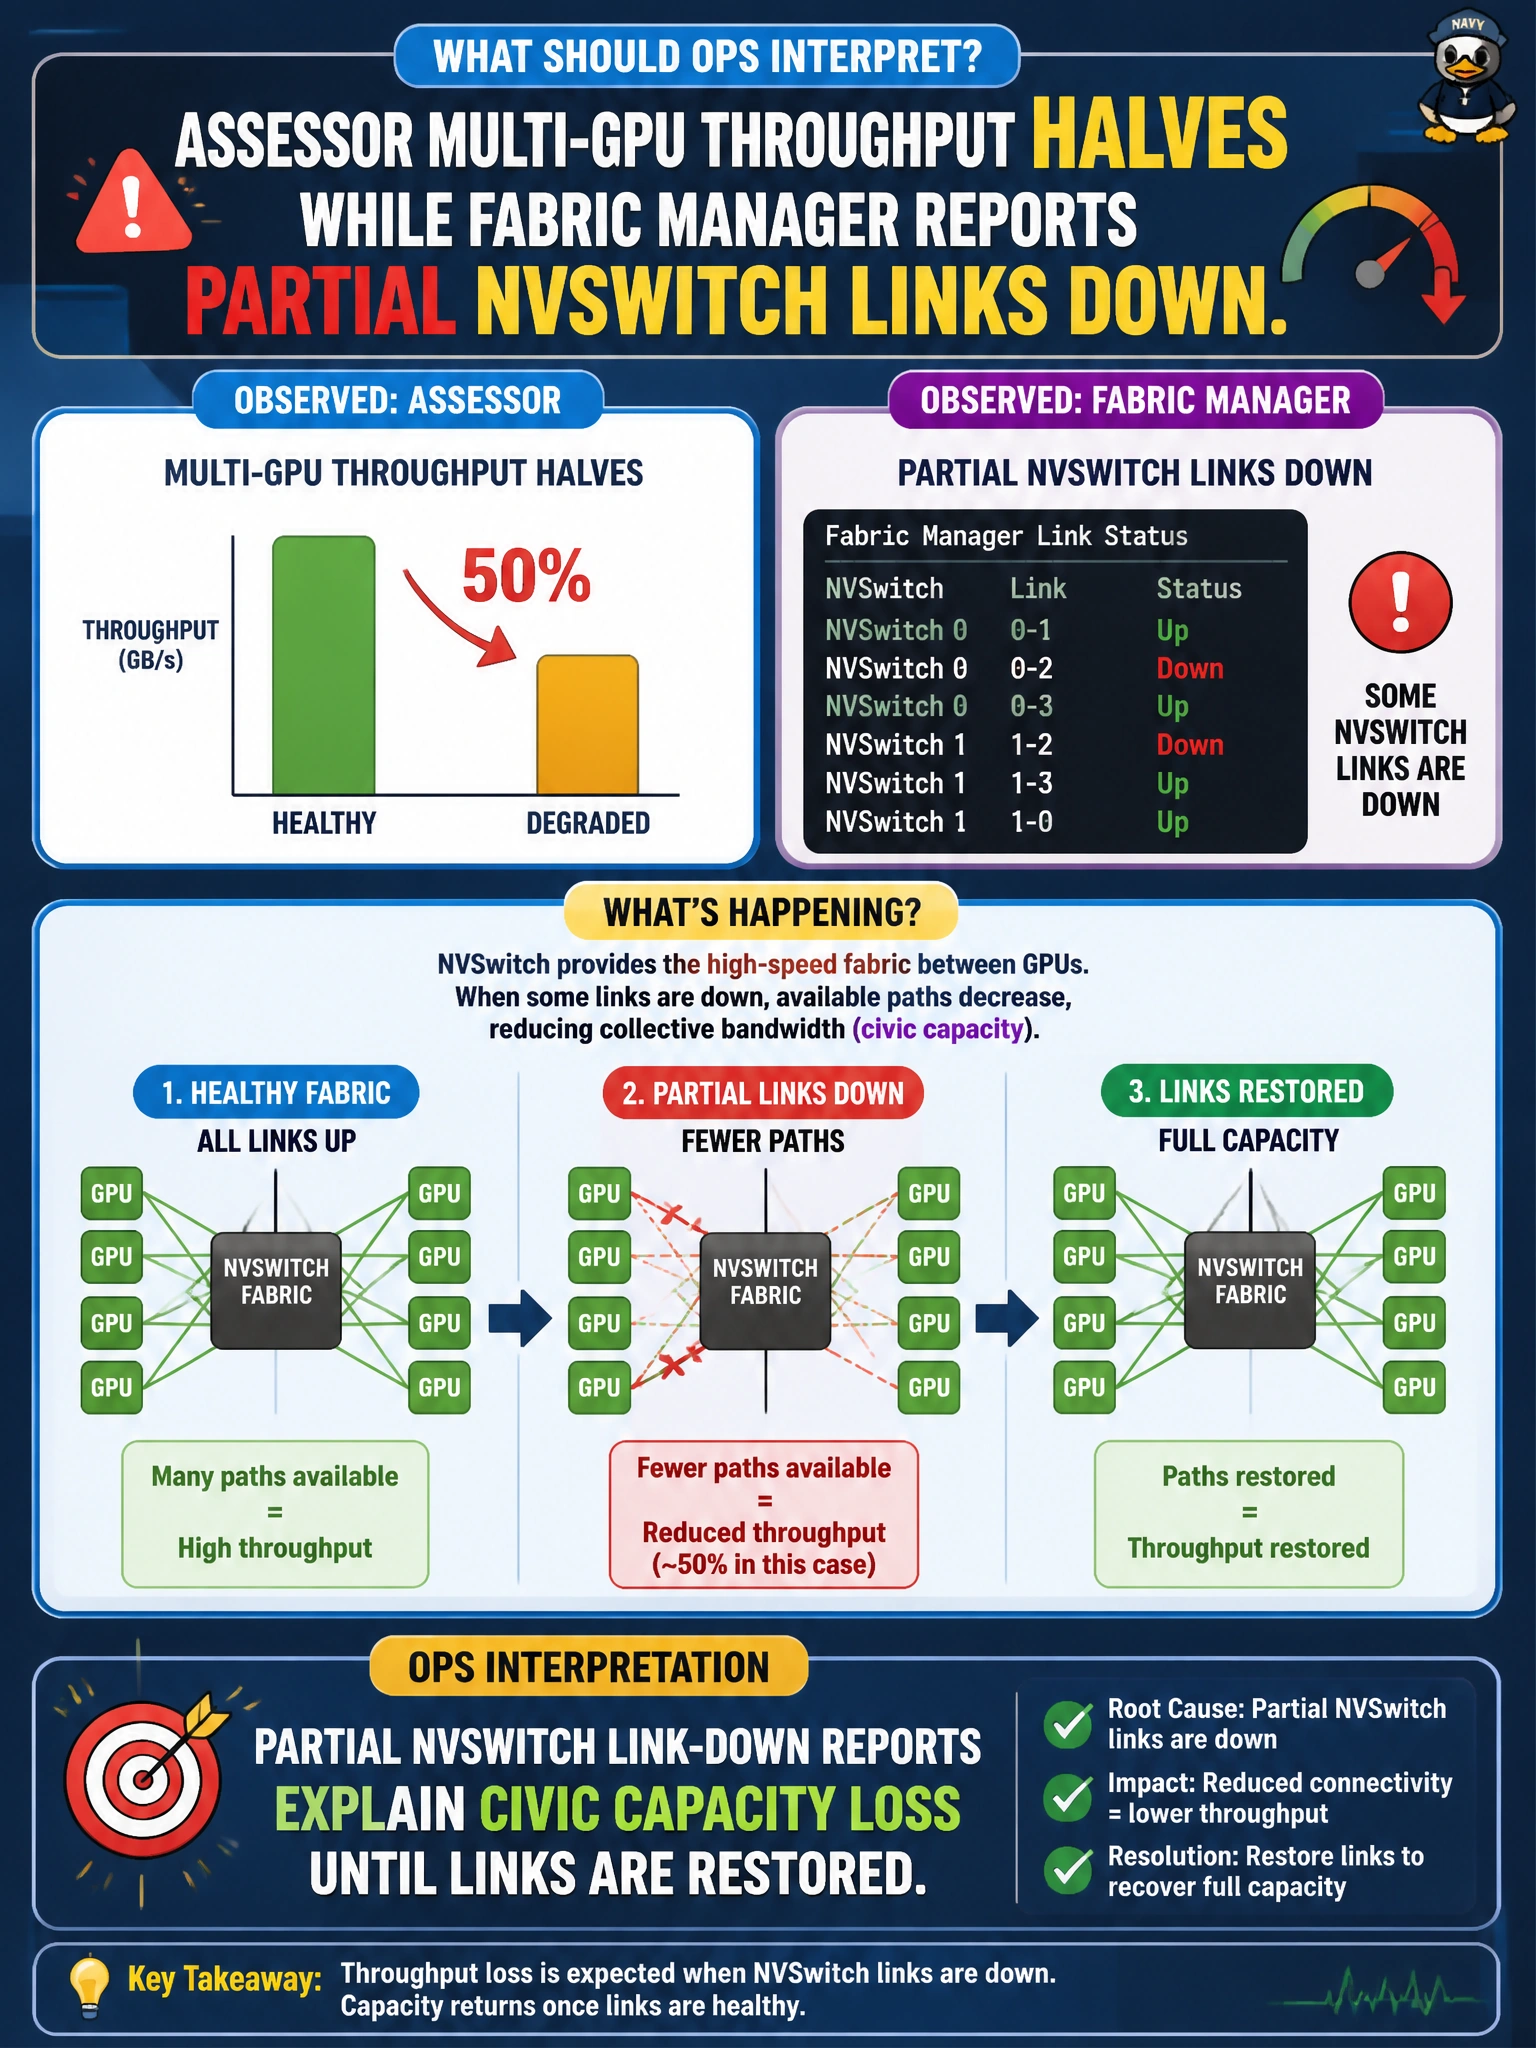
When you see half the assessor throughput alongside partial NVSwitch links down, interpret it as fabric capacity loss until the links are restored. Check the fabric manager report before rewriting the model; that addresses the reported cause rather than the symptom.
Full Explanation
When assessor multi-GPU throughput halves while the fabric manager reports partial NVSwitch links down, interpret the drop as lost fabric capacity until the links are restored. Partial link-down reduces available NVSwitch bandwidth and can force less efficient routes or leave peers stranded, reducing effective all-reduce and peer-copy performance even when every GPU still enumerates. The fabric manager report explains the throughput cliff without blaming the assessor model first. The claim that a throughput drop always points to a flawed assessor model fails conceptually: after a fabric alert, the interconnect is a plausible cause that must be checked. Calling partial link-down cosmetic ignores that lost links reduce aggregate fabric capacity. Process lists from nvidia-smi show compute PIDs; they do not retrain or reseat switch links, so they cannot repair the fabric. Exam caveat: a roughly halved throughput is plausible with partial links down, but verify the impact with bandwidth tests; do not confuse application batch-size changes with fabric loss when link-down is explicitly reported. Practical check: identify the down links, follow hardware and link remediation such as reseating, replacement, or firmware work, confirm the fabric manager reports links up, benchmark multi-GPU bandwidth or NCCL, then rerun the assessor job to verify throughput recovers before closing the incident.