
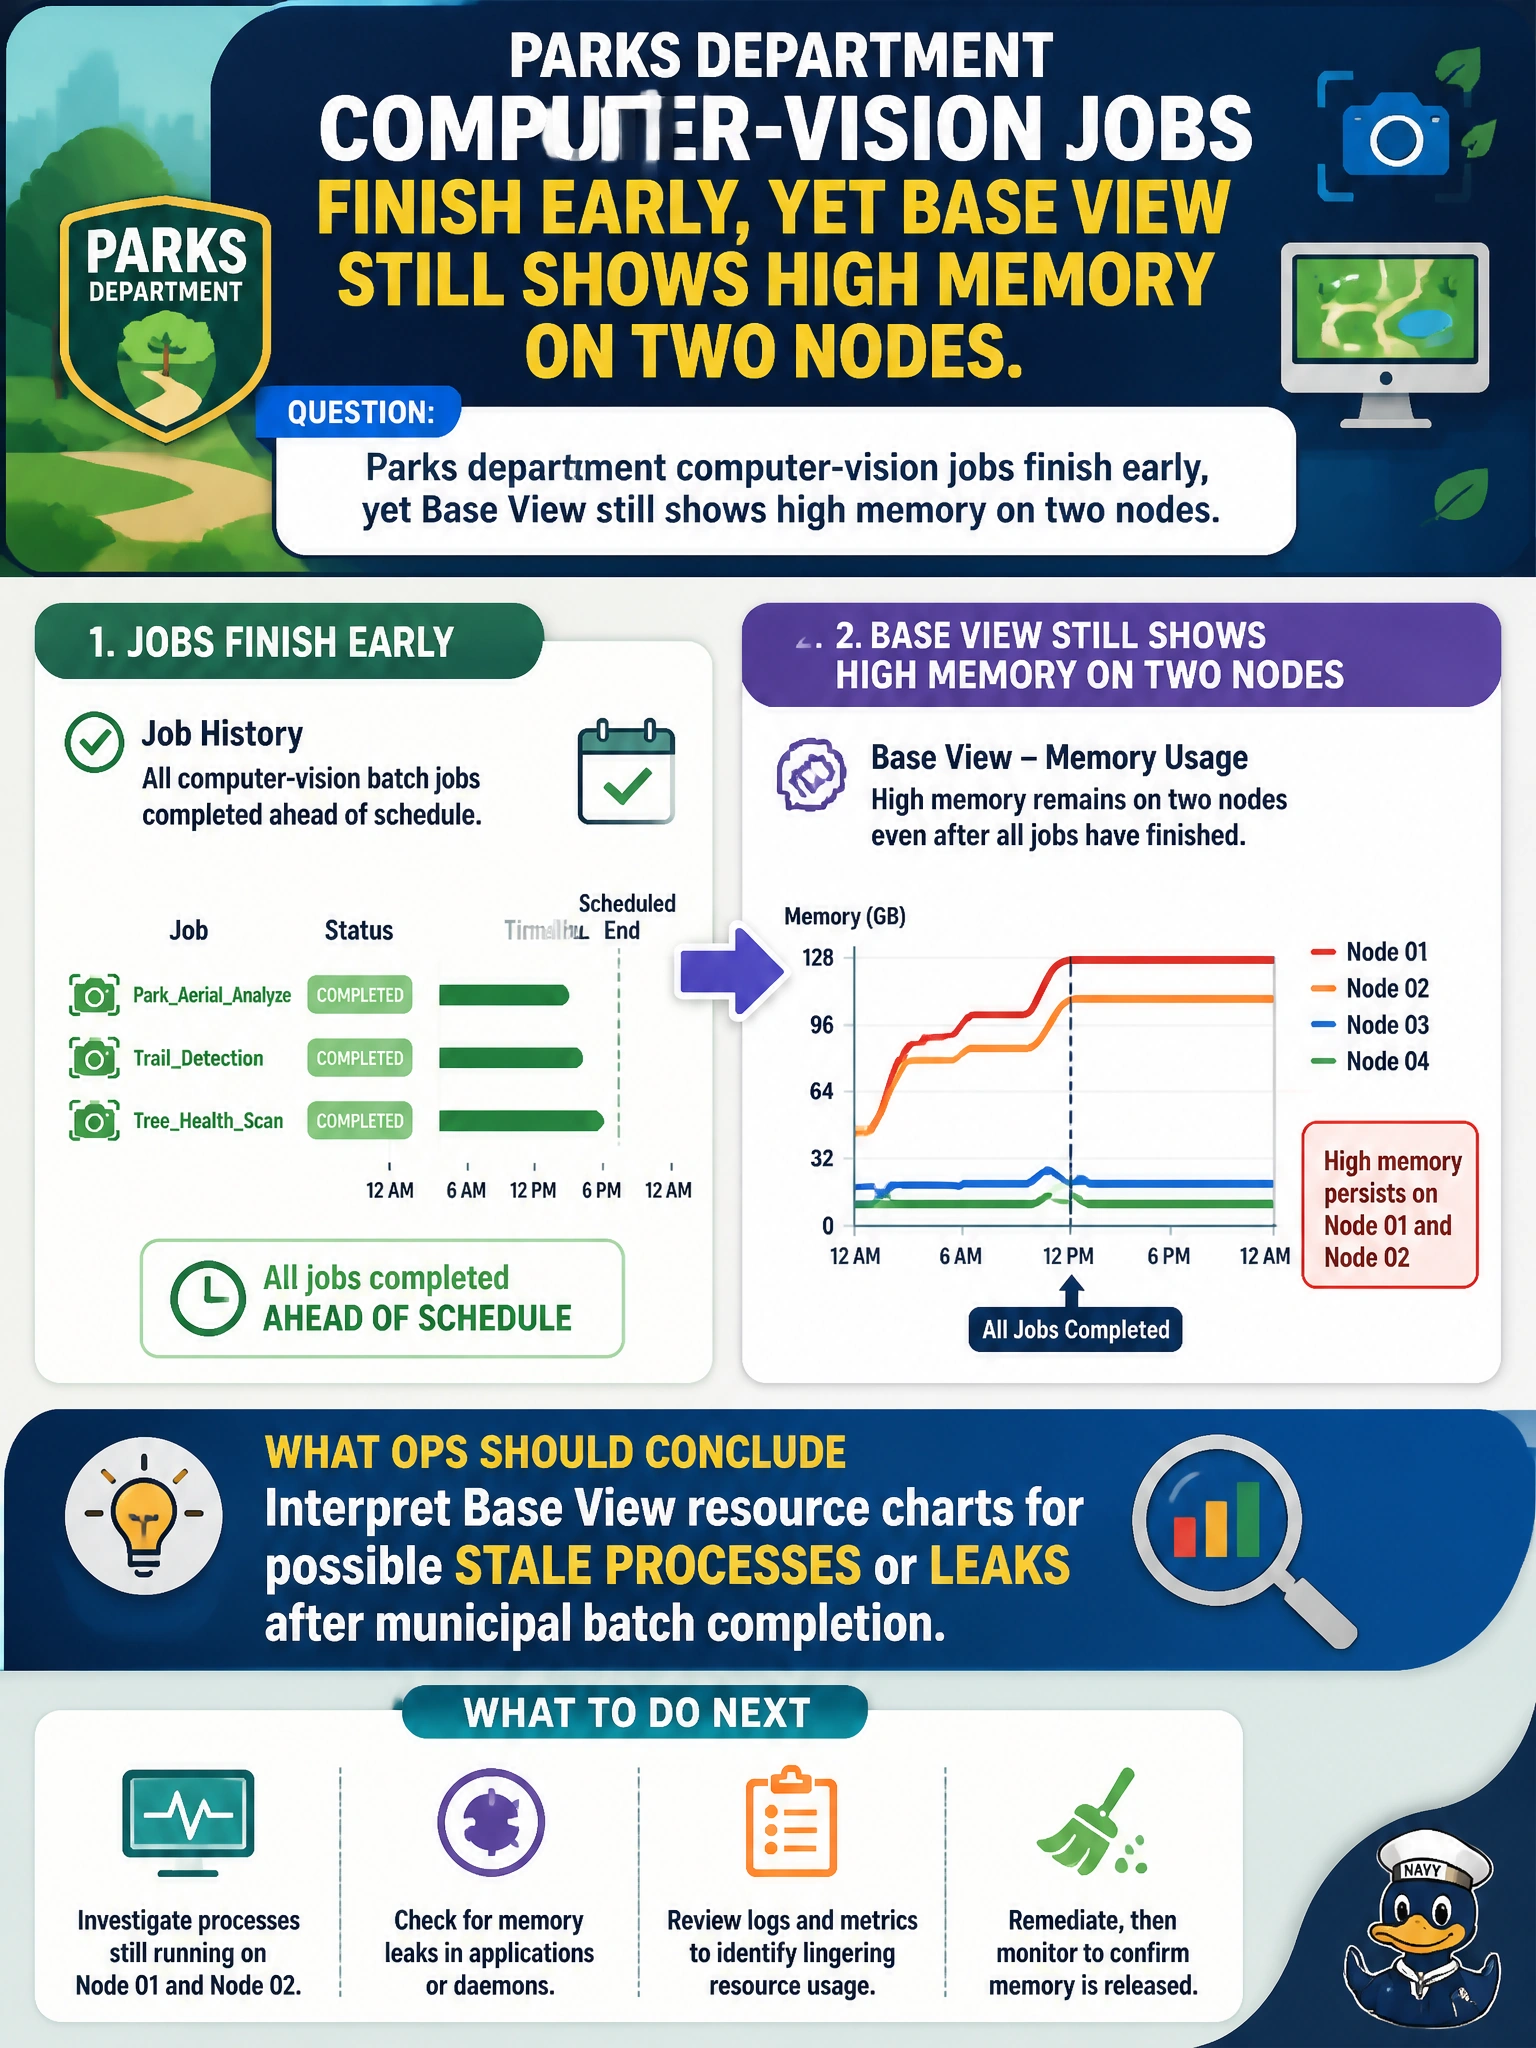
Parks department computer-vision jobs finish early, yet Base View still shows high memory on two nodes. What should ops conclude about those charts?
Select an answer to reveal the explanation.
Short Explanation
Jobs saying “done” while memory stays pegged is like the park lights still blazing after closing time—something may still be running or leaking. Base View’s resource charts are how you spot that leftover footprint. Do not jump to RMA or shrug the meters off just because the batch queue looks empty.
Full Explanation
If parks department computer-vision jobs finish early yet Base View still shows high memory on two nodes, operators should interpret those resource charts as possible stale processes, incomplete cleanup, or memory leaks—not as automatic hardware failure. Base View’s purpose includes correlating post-job resource footprints with what the workload manager believes is idle. Jumping to “high memory always proves GPUs are physically defective and must be RMA’d today” skips process inspection and wastes vendor cycles on soft leaks. Claiming Base View charts are unrelated to memory and can be ignored after any job exit discards the monitoring surface when it is most useful—after the batch queue looks empty. Asserting memory metrics only apply to CPU-only municipal workloads is false; GPU nodes still expose host and device memory signals ops must read for civic CV estates. Exam caveat: persistent unexplained memory growth after cleanup can eventually justify hardware diagnostics—but RMA is a last step after confirming processes, containers, and driver state. Operational check: identify the two nodes in Base View, list residual processes/containers via BCM/job tooling, clear or restart the offending services, watch memory return to baseline, and only escalate hardware if the footprint returns with an empty workload set.