
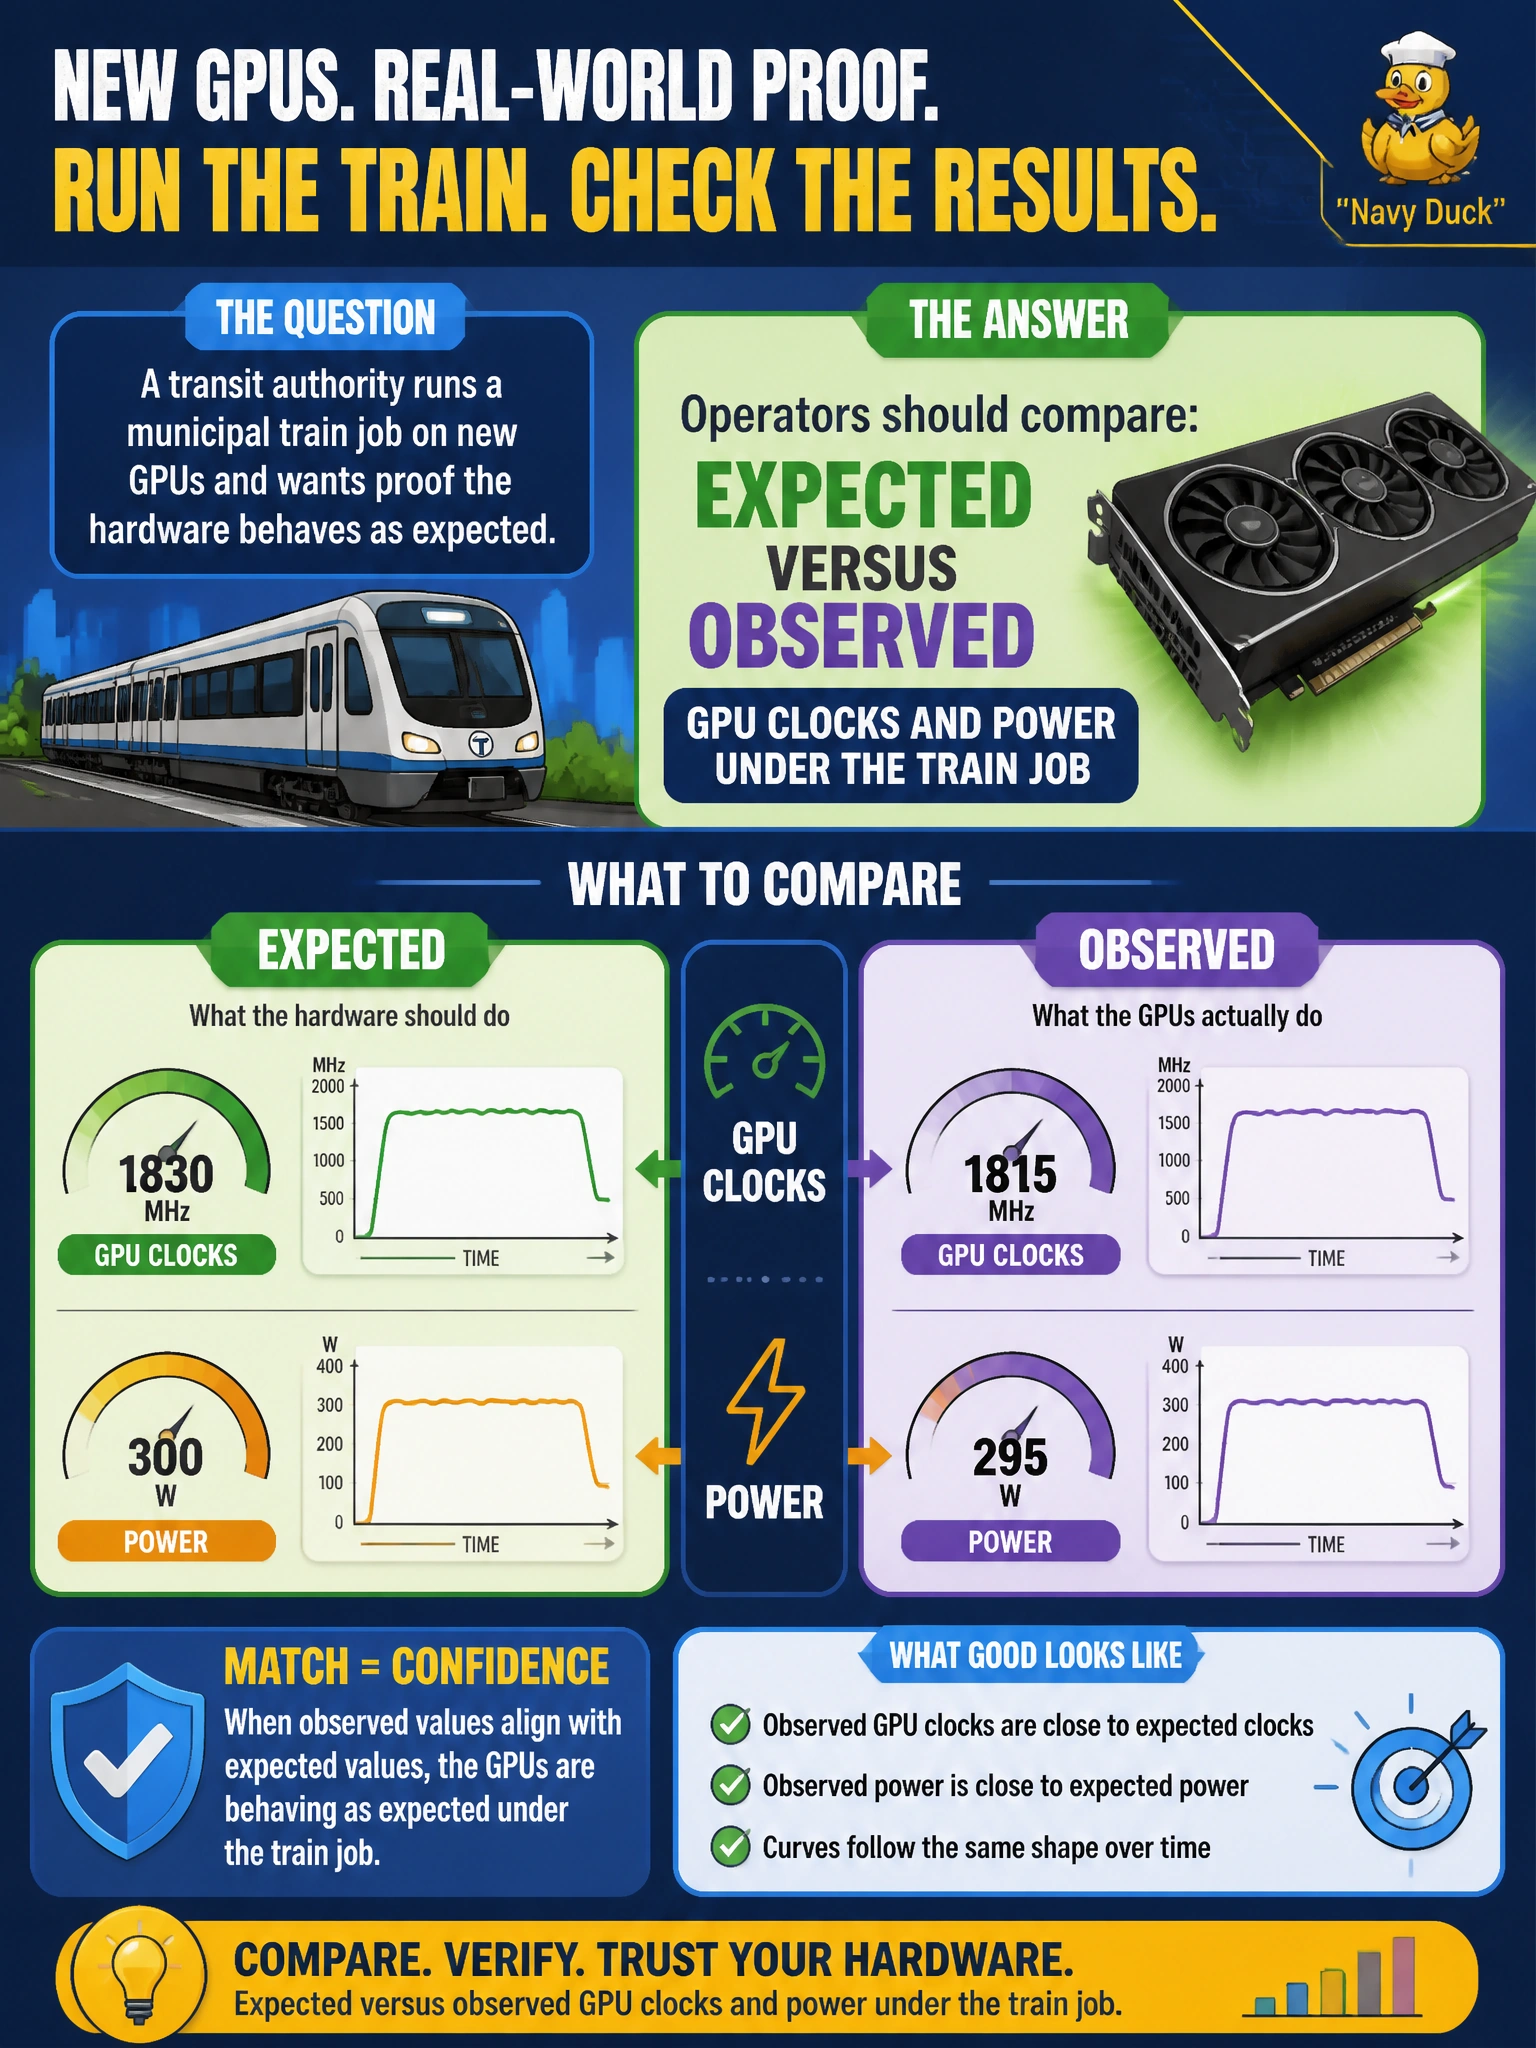
A transit authority runs a municipal train job on new GPUs and wants proof the hardware behaves as expected. What should operators compare?
Select an answer to reveal the explanation.
Short Explanation
Under a train job, compare the clocks and watts you expected to what the GPUs actually show—like checking speedometer and fuel burn on a route trial, not just admiring dashboard LEDs.
Full Explanation
A transit authority running a municipal train job on new GPUs needs quantitative proof that hardware behaves as designed under that job. Comparing expected versus observed GPU clocks and power under the train workload shows whether the adapters reach intended performance envelopes, whether power limits or thermal caps intervene, and whether the node is delivering the capacity planners assumed. That comparison turns a green LED story into an evidence-based accept/reject decision for transit AI capacity. Comparing only the color of front-panel LEDs under idle fails by concept: idle LED state does not encode clock or power behavior under the train job. Comparing wiki page titles against a marketing brochure fails by concept: documentation branding is unrelated to measured hardware telemetry. Using room ambient humidity alone as a GPU performance metric fails by concept: humidity may matter for facility limits, but it is not a substitute for GPU clock and power observation under load. Exam caveat: expected ranges must come from the platform’s known-good baseline or vendor guidance for that GPU SKU and power policy; comparing against an unrelated node’s numbers can falsely fail or pass a transit host. Operational check: during the municipal train job, capture GPU clocks and power via SMI or telemetry, compare against documented expectations, investigate deviations before production acceptance, and archive the comparison with the change record.