
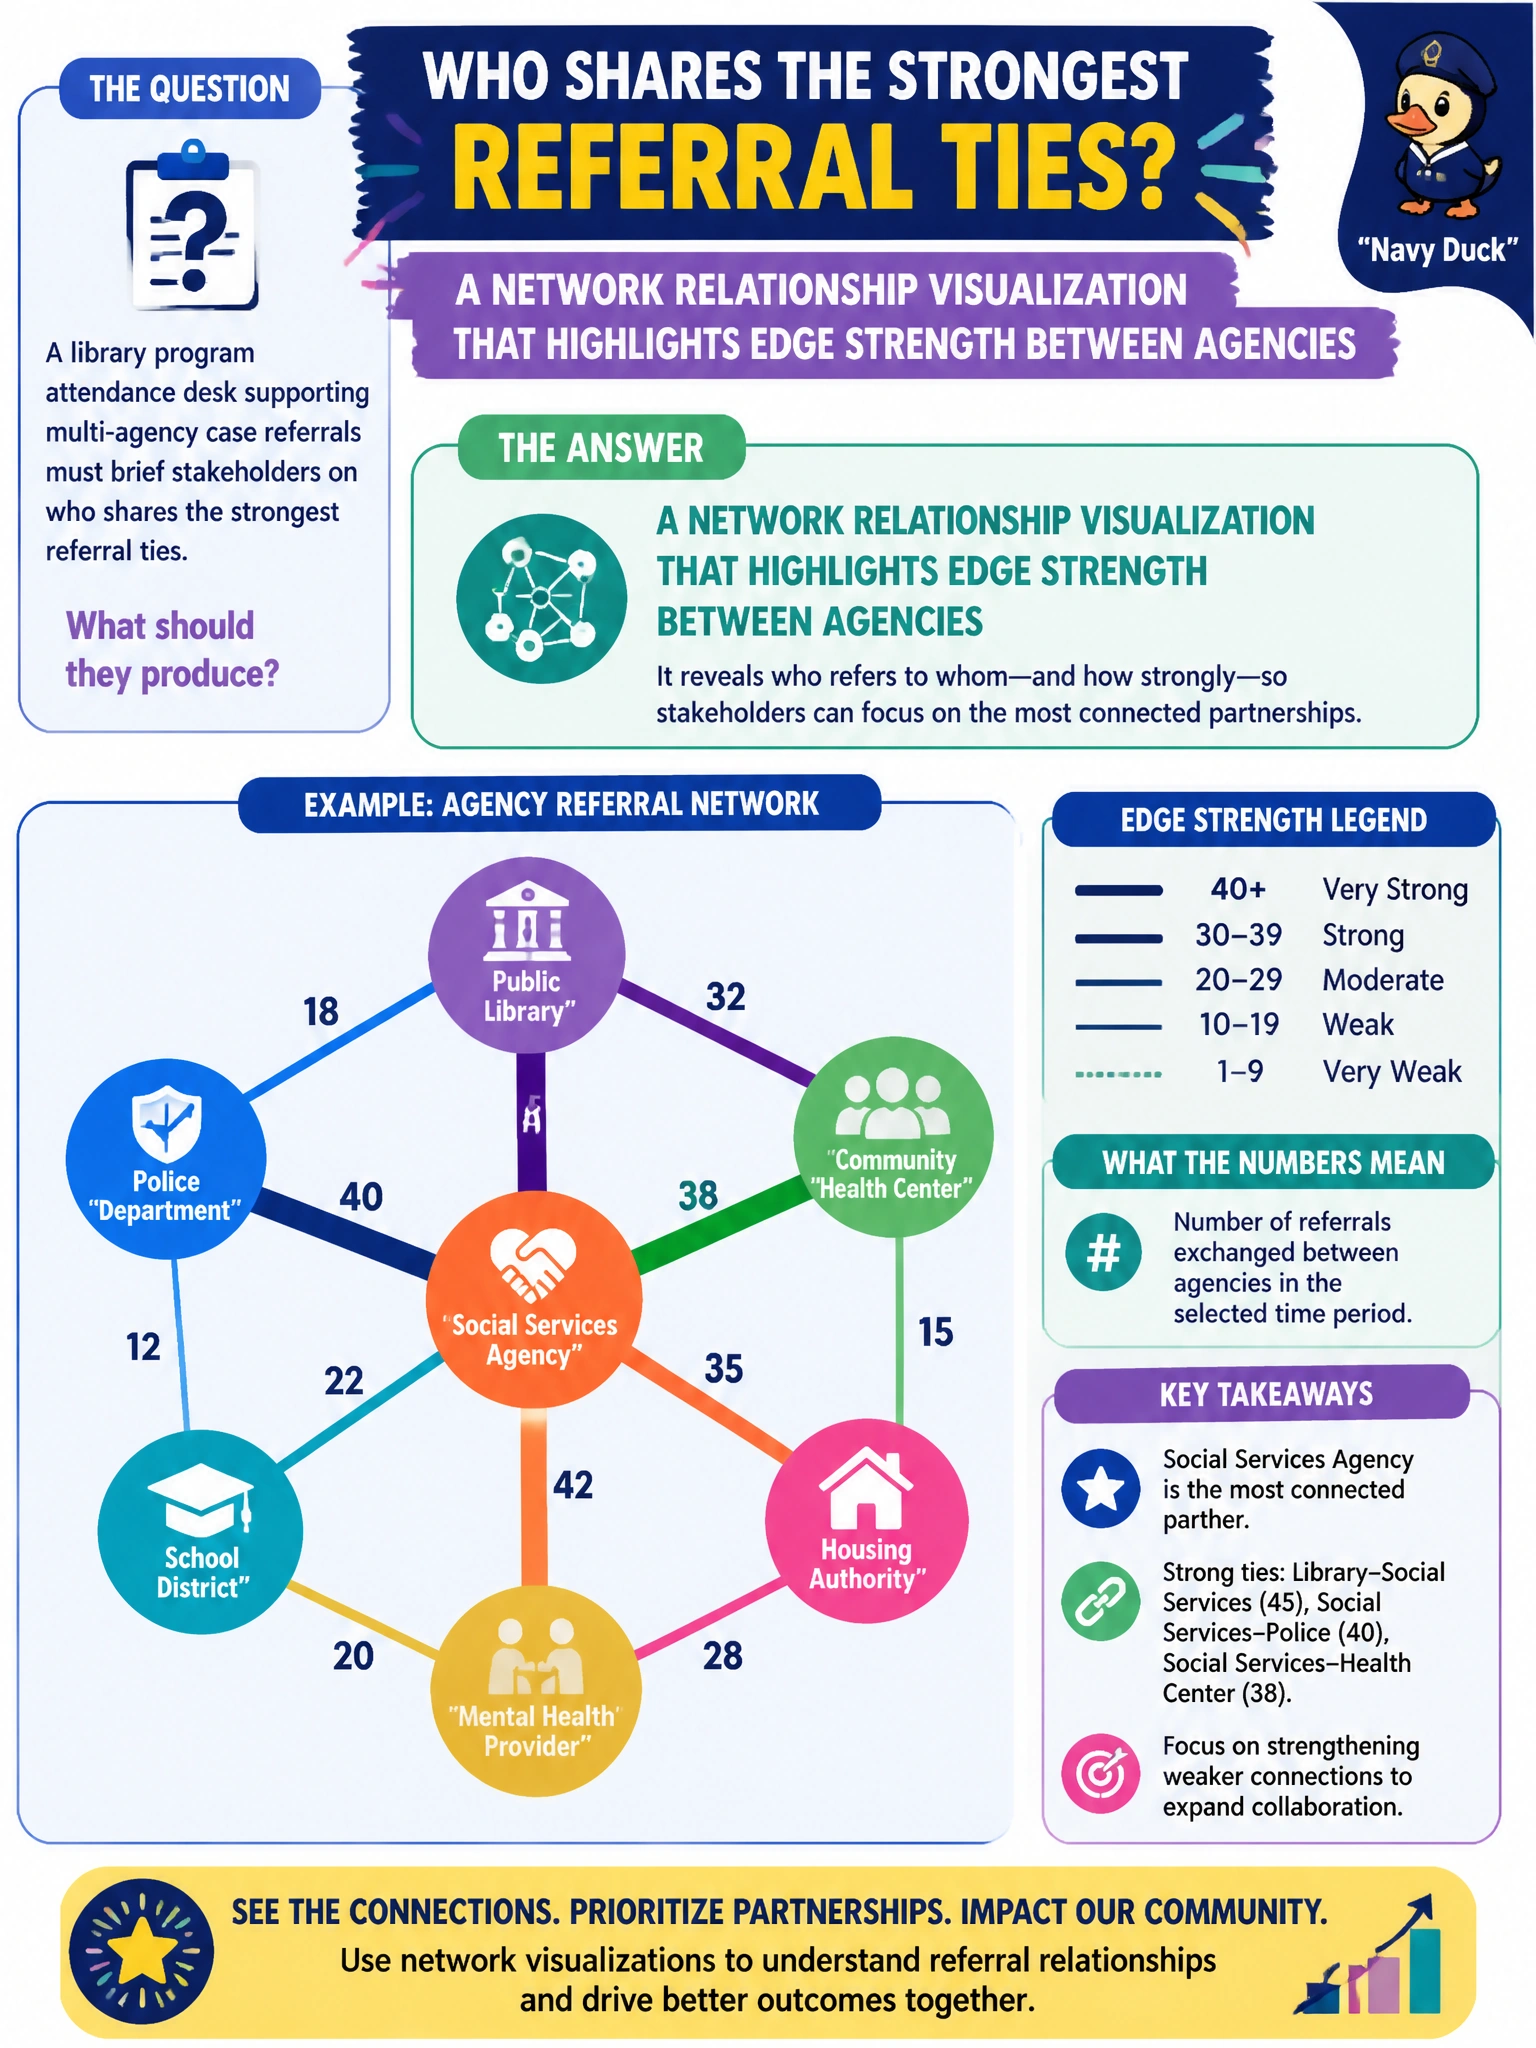
A library program attendance desk supporting multi-agency case referrals must brief stakeholders on who shares the strongest referral ties. What should they produce?
Select an answer to reveal the explanation.
Short Explanation
Stakeholders see the handshakes between agencies best when you draw the web and thicken the strong referral ties—not when you hand them raw SQL.
Full Explanation
A library program attendance desk supporting multi-agency case referrals must brief stakeholders on who shares the strongest referral ties. That is a relationship-communication task: decision makers need to see entities and the strength of links between them. The correct deliverable is a network relationship visualization that highlights edge strength between agencies so non-technical stakeholders can grasp concentration, bridges, and weak ties without reading graph algebra.
A single paragraph of raw SQL with no visual of links may be reproducible for engineers but fails as a stakeholder briefing artifact—it does not show topology. Only a bar chart of total books checked out citywide reports an unrelated library KPI and says nothing about referral ties. A GPU driver version table is infrastructure noise in this context and does not communicate network relationships at all.
Exam caveat: Domain 7 emphasizes that relationship insights must be communicated; visualization is the associate-level bridge from graph metrics to civic action. Visual design still needs honest encoding—edge thickness or color should map to a defined strength metric, and layouts should not imply geography unless the layout is geo-based.
Operational check: compute edge weights from referral counts or rates, render a readable network view with a legend, validate the strongest ties against program staff knowledge, and export both the image and the underlying edge list so the briefing is auditable after the meeting.