
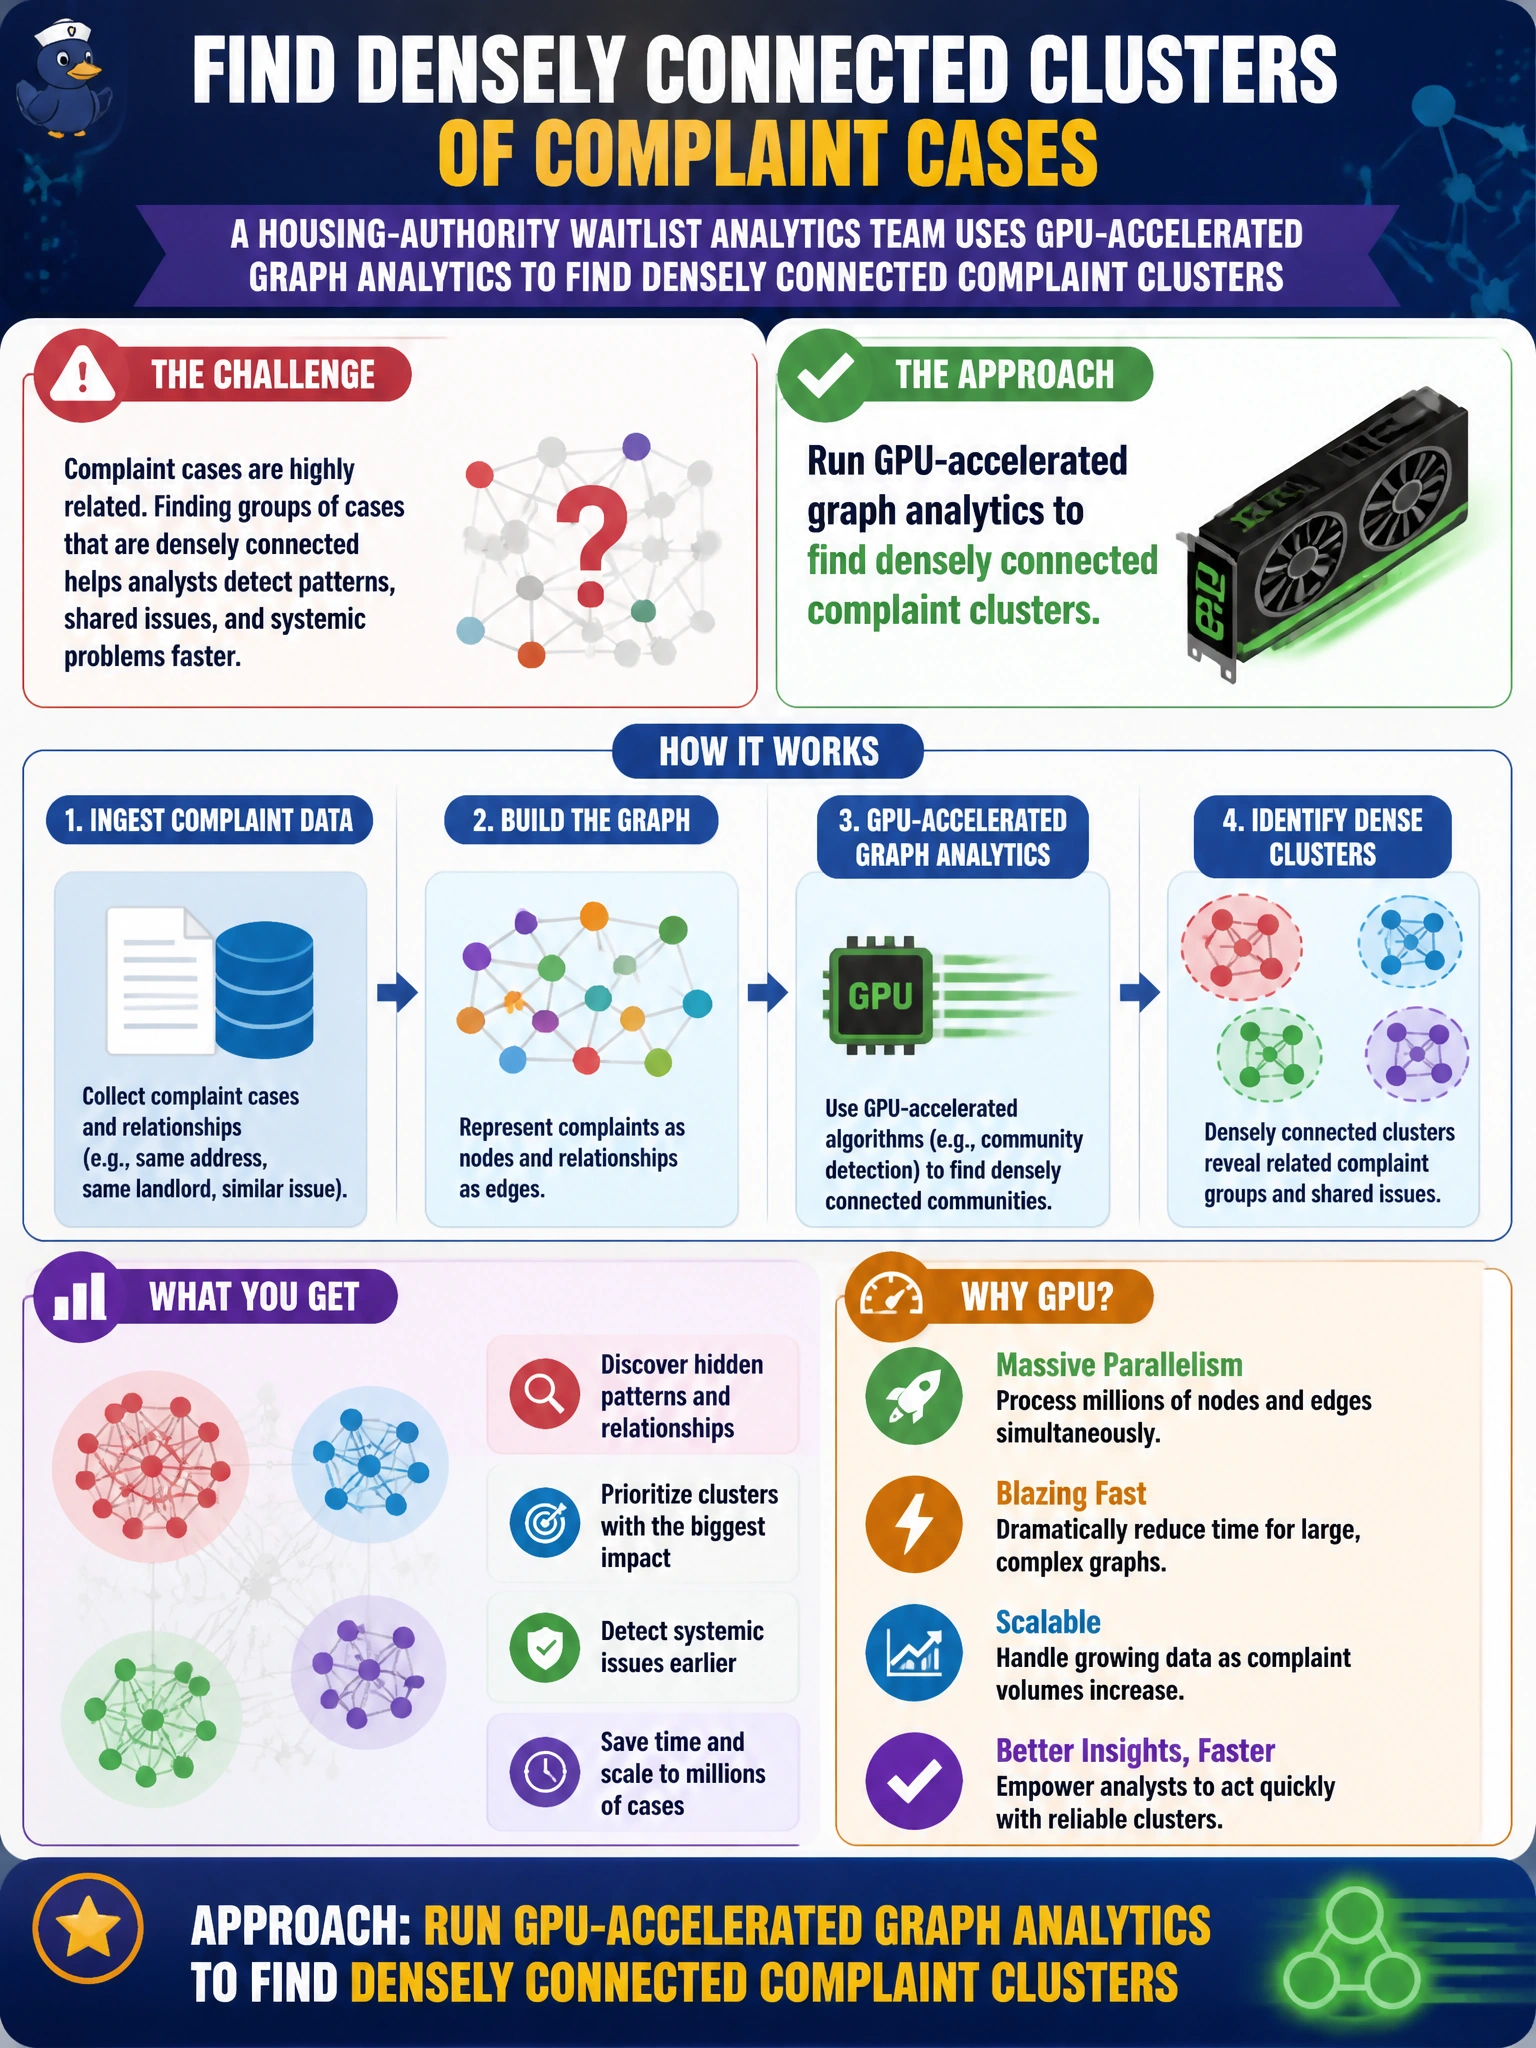
A housing-authority waitlist analytics team wants densely connected clusters among related complaint cases on a large graph. What approach fits associate GPU practice?
Select an answer to reveal the explanation.
Short Explanation
When complaint cases tangle into a big web, let GPU graph analytics find the tight knots instead of circling printouts with a highlighter.
Full Explanation
A housing-authority waitlist analytics team seeking densely connected clusters among related complaint cases on a large graph needs algorithms that exploit edge structure at scale. Densely connected subgraphs (communities, clusters) reveal related complaint bundles that manual review will miss once the case graph grows. Associate GPU practice is to run GPU-accelerated graph analytics to find those densely connected complaint clusters efficiently on municipal-scale graphs.
Printing the full adjacency list to PDF and circling clusters by hand does not scale, is non-reproducible, and fails on graphs beyond a few dozen nodes. Ignoring edges and running only univariate histograms on case age analyzes attributes while discarding the relationships that define “related” cases. Converting the graph to a single mean centrality number collapses rich cluster structure into one global summary and cannot localize dense complaint communities.
Exam caveat: GPU graph libraries accelerate community detection, connected components, and similar kernels—they do not invent edge semantics. Garbage entity resolution (duplicate tenants, weak complaint links) produces garbage clusters regardless of hardware. Choose algorithms matched to undirected similarity edges versus directed escalation edges.
Operational check: define how complaint–complaint edges are built (shared unit, shared issue code, co-occurrence window), run accelerated clustering on the validated graph, and sample cluster members with caseworkers to confirm the dense groups reflect actionable housing issues before changing waitlist or inspection priorities.