
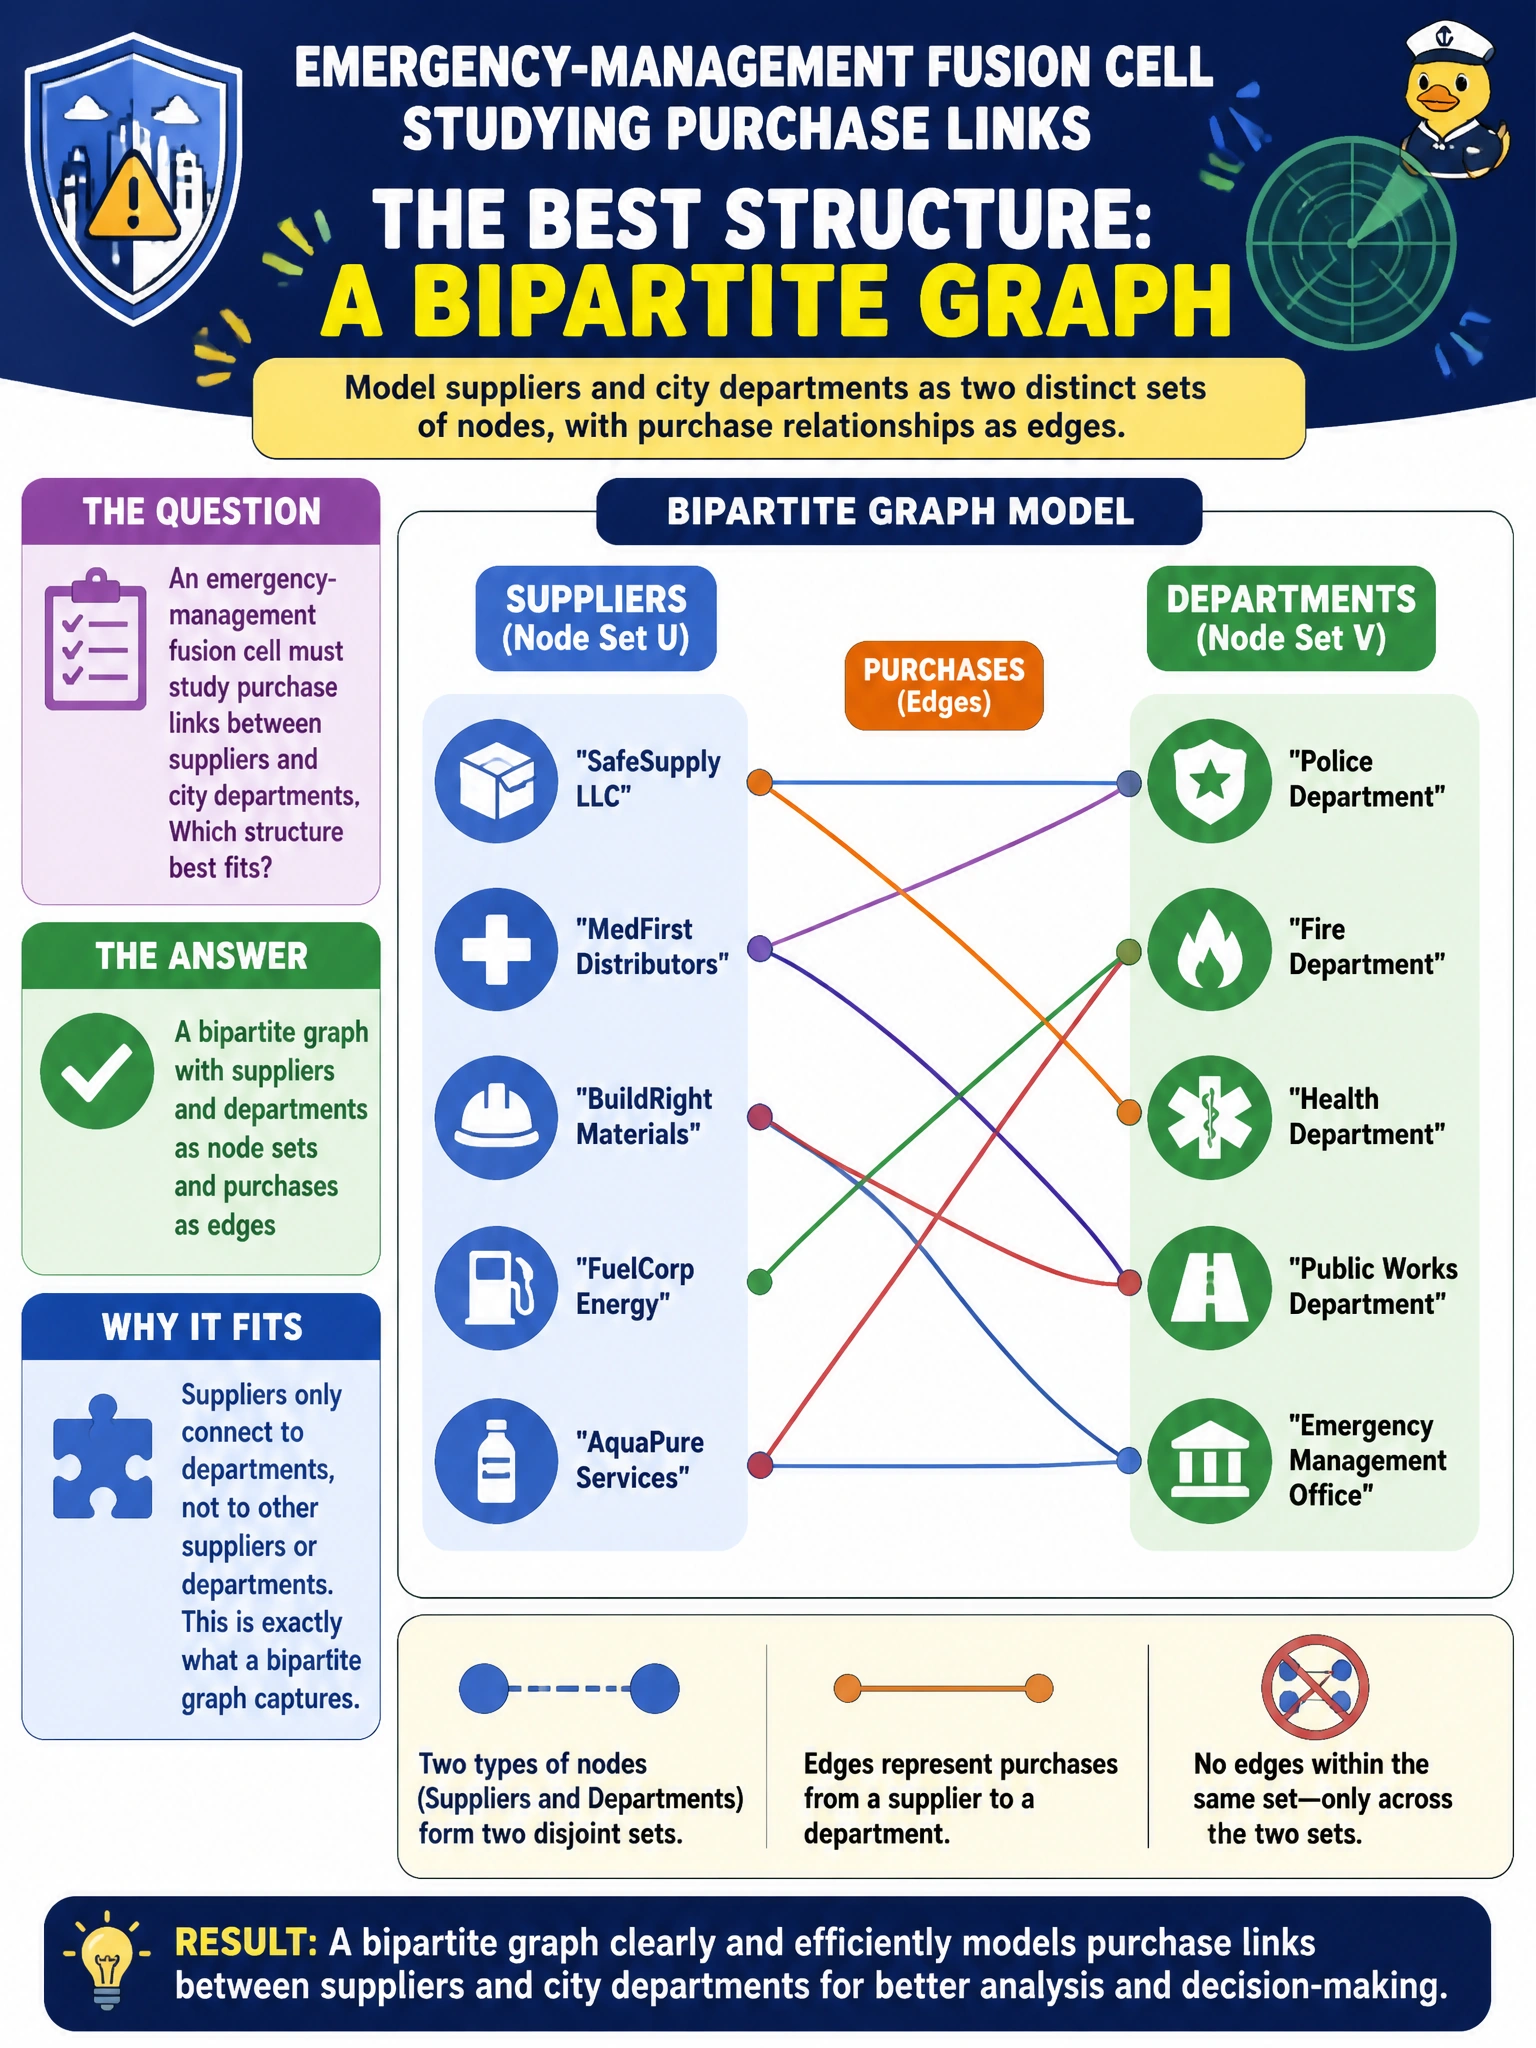
An emergency-management fusion cell must study purchase links between suppliers and city departments. Which structure best fits?
Select an answer to reveal the explanation.
Short Explanation
Suppliers on one side, departments on the other, purchases as the bridges—that's a bipartite graph, not just a pile of dollar totals.
Full Explanation
An emergency-management fusion cell studying purchase links between suppliers and city departments is dealing with two distinct entity types and the transactions that connect them. That pattern is the definition of a bipartite graph: one partition for suppliers, one for departments, and edges for purchases (optionally weighted by dollars, frequency, or criticality). This structure supports link analysis, concentration risk, and single-source dependency questions that matter in emergency procurement.
A single sorted CSV of dollar totals with no entity pairing loses who bought from whom, so concentration and dependency cannot be reconstructed. A time-series-only table that drops supplier and department identifiers may show spending trends but cannot represent purchase links. A confusion matrix of weather codes unrelated to purchasing is the wrong abstraction entirely—it answers classification error for weather labels, not procurement topology.
Exam caveat: bipartite graphs can be projected to one-mode networks (department–department via shared suppliers), but projection changes interpretation and can inflate density; know which view the fusion cell needs before projecting. Edge weights and time stamps on purchases are often essential for emergency surge analysis.
Operational check: ingest procurements with stable supplier and department IDs, construct the bipartite graph with documented weight semantics, and verify high-degree suppliers against known critical-vendor lists before briefing emergency managers on link risks.