
A transit authority connectivity desk wants to analyze bus stops and transfer links for service gaps. How should they represent the network?
Select an answer to reveal the explanation.
Short Explanation
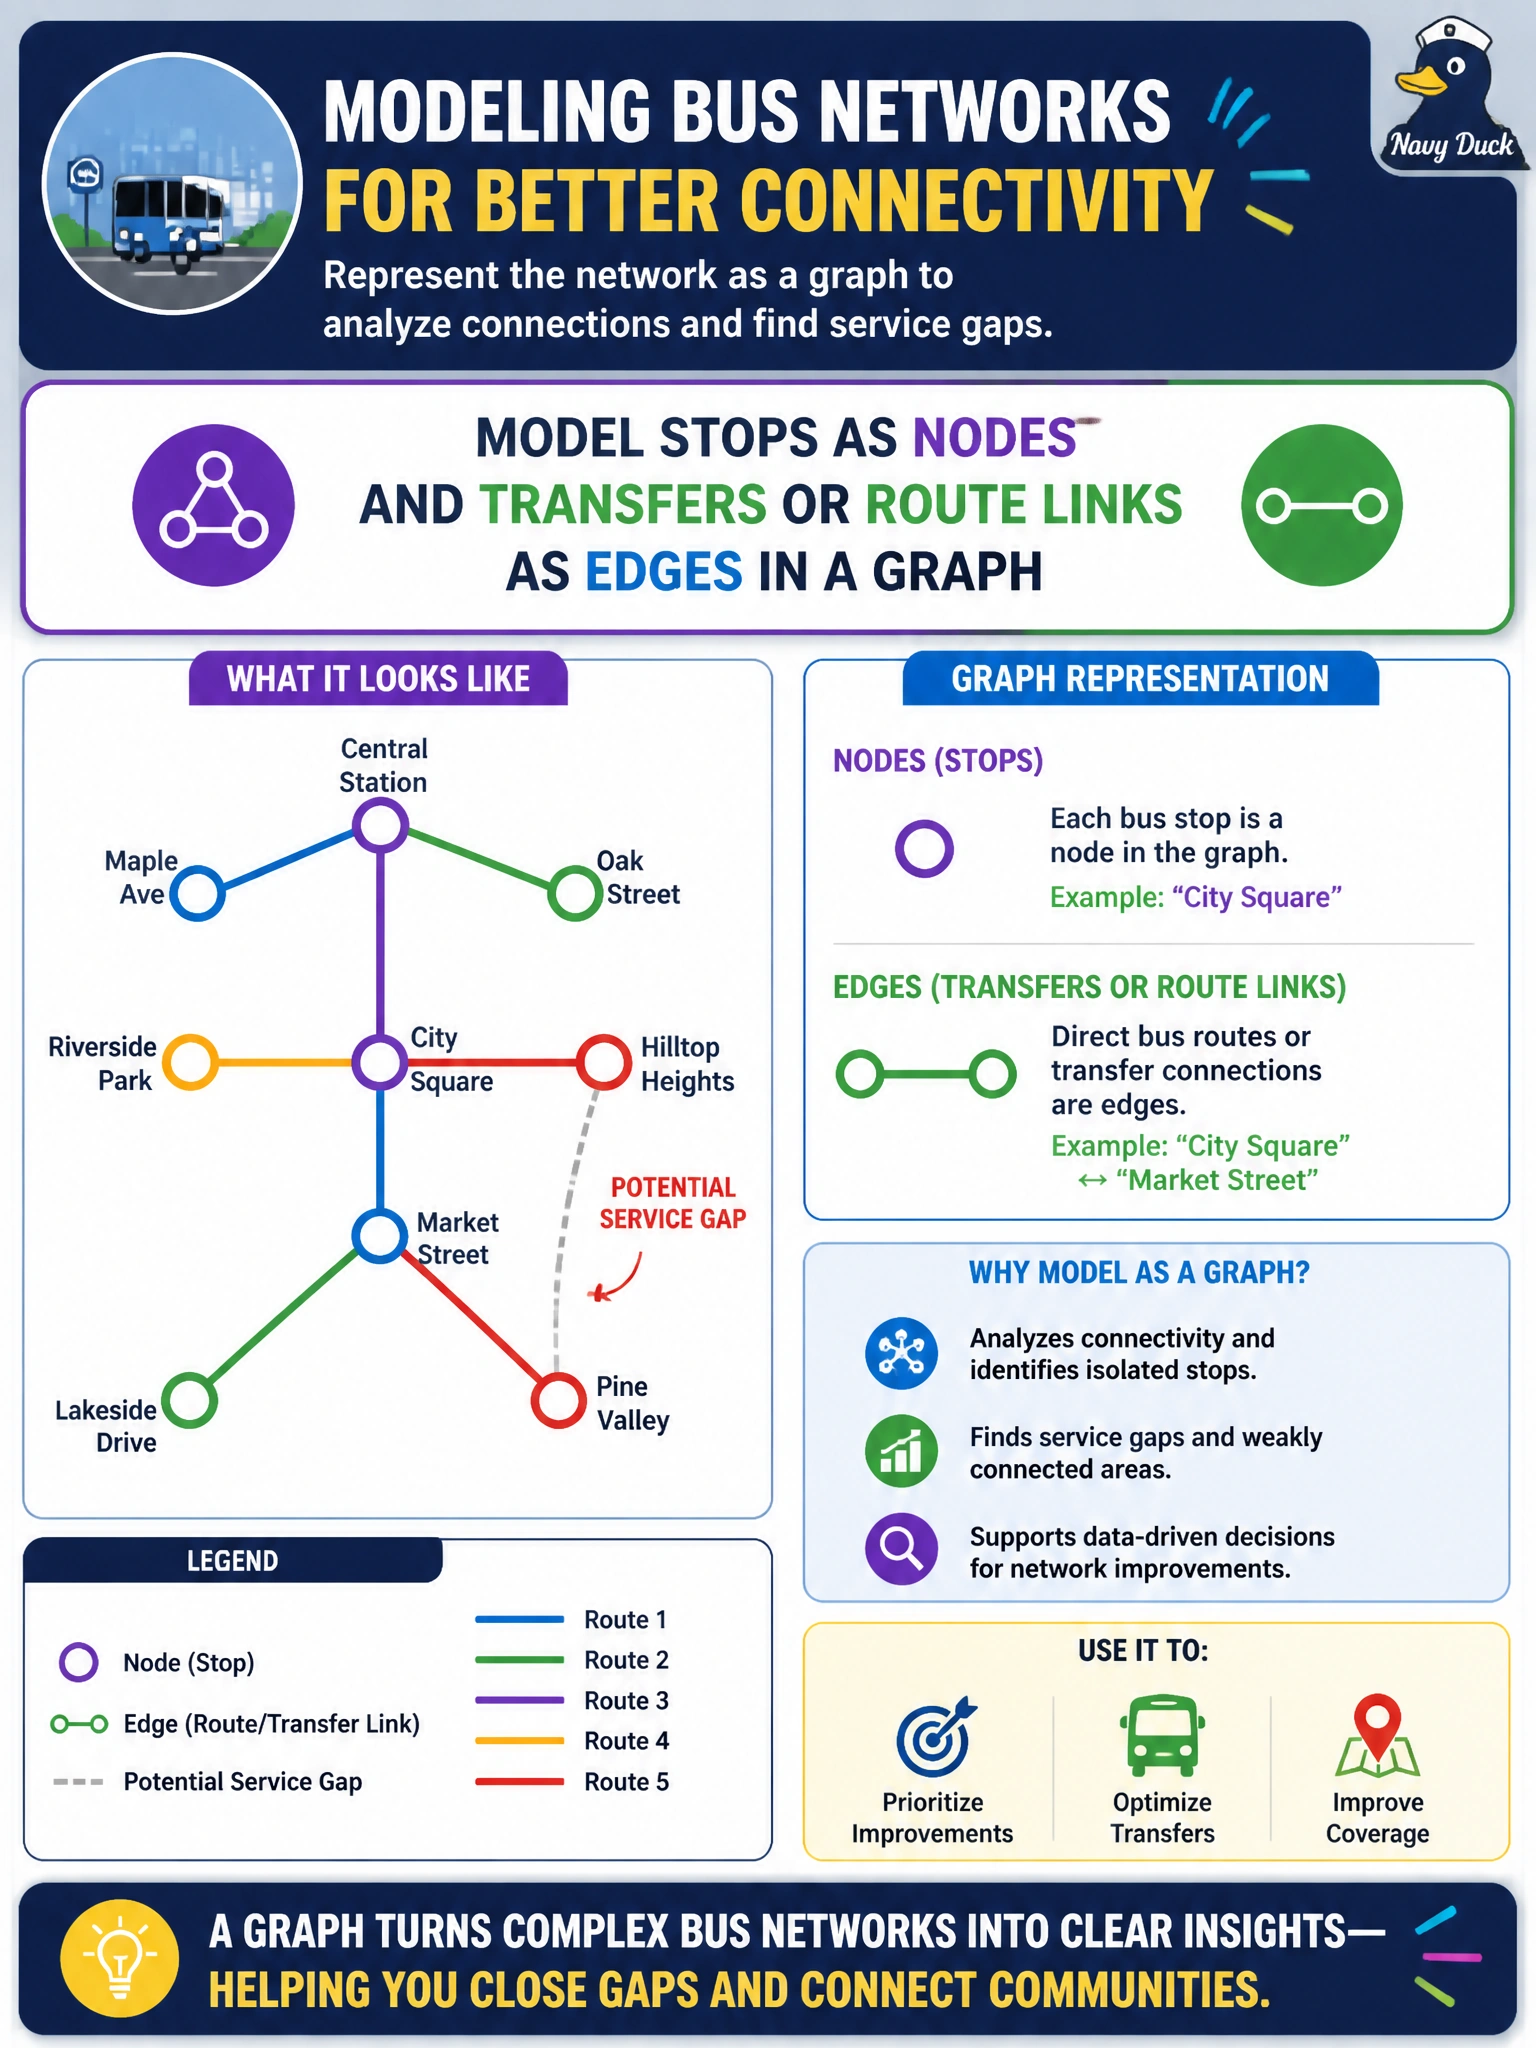
Stops are dots, transfers are lines—draw the city as a graph so connectivity questions have somewhere to live.
Full Explanation
A transit authority connectivity desk analyzing bus stops and transfer links for service gaps needs a representation that preserves topology. Connectivity, transfer opportunities, and gap detection are relationship questions: which stops connect, through which links, and where the network fractures. The correct representation models stops as nodes and transfers or route links as edges in a graph so path, degree, and community structure become first-class analytics objects.
Storing only a flat list of stop names with no relationships retains entities but deletes the links that define connectivity, so service-gap questions cannot be answered structurally. Encoding the network solely as independent hourly ridership scalars may support demand forecasting but does not encode which stops transfer to which; volume alone is not topology. Replacing stops with a single citywide average delay metric collapses the network into one number and erases local gaps the desk must find.
Exam caveat: graphs complement, rather than replace, ridership time series—Domain 7 relationship analysis is about structure; temporal demand is a different question that may later annotate nodes or edges with weights. Choosing a graph does not automatically select directed versus undirected or weighted edges; those follow from how transfers work operationally.
Operational check: build the stop-transfer graph from authoritative GTFS or CAD/AVL link tables, validate isolated nodes and unexpected cut edges against known routes, and only then run connectivity or gap algorithms so findings map back to real bus stops stakeholders recognize.