
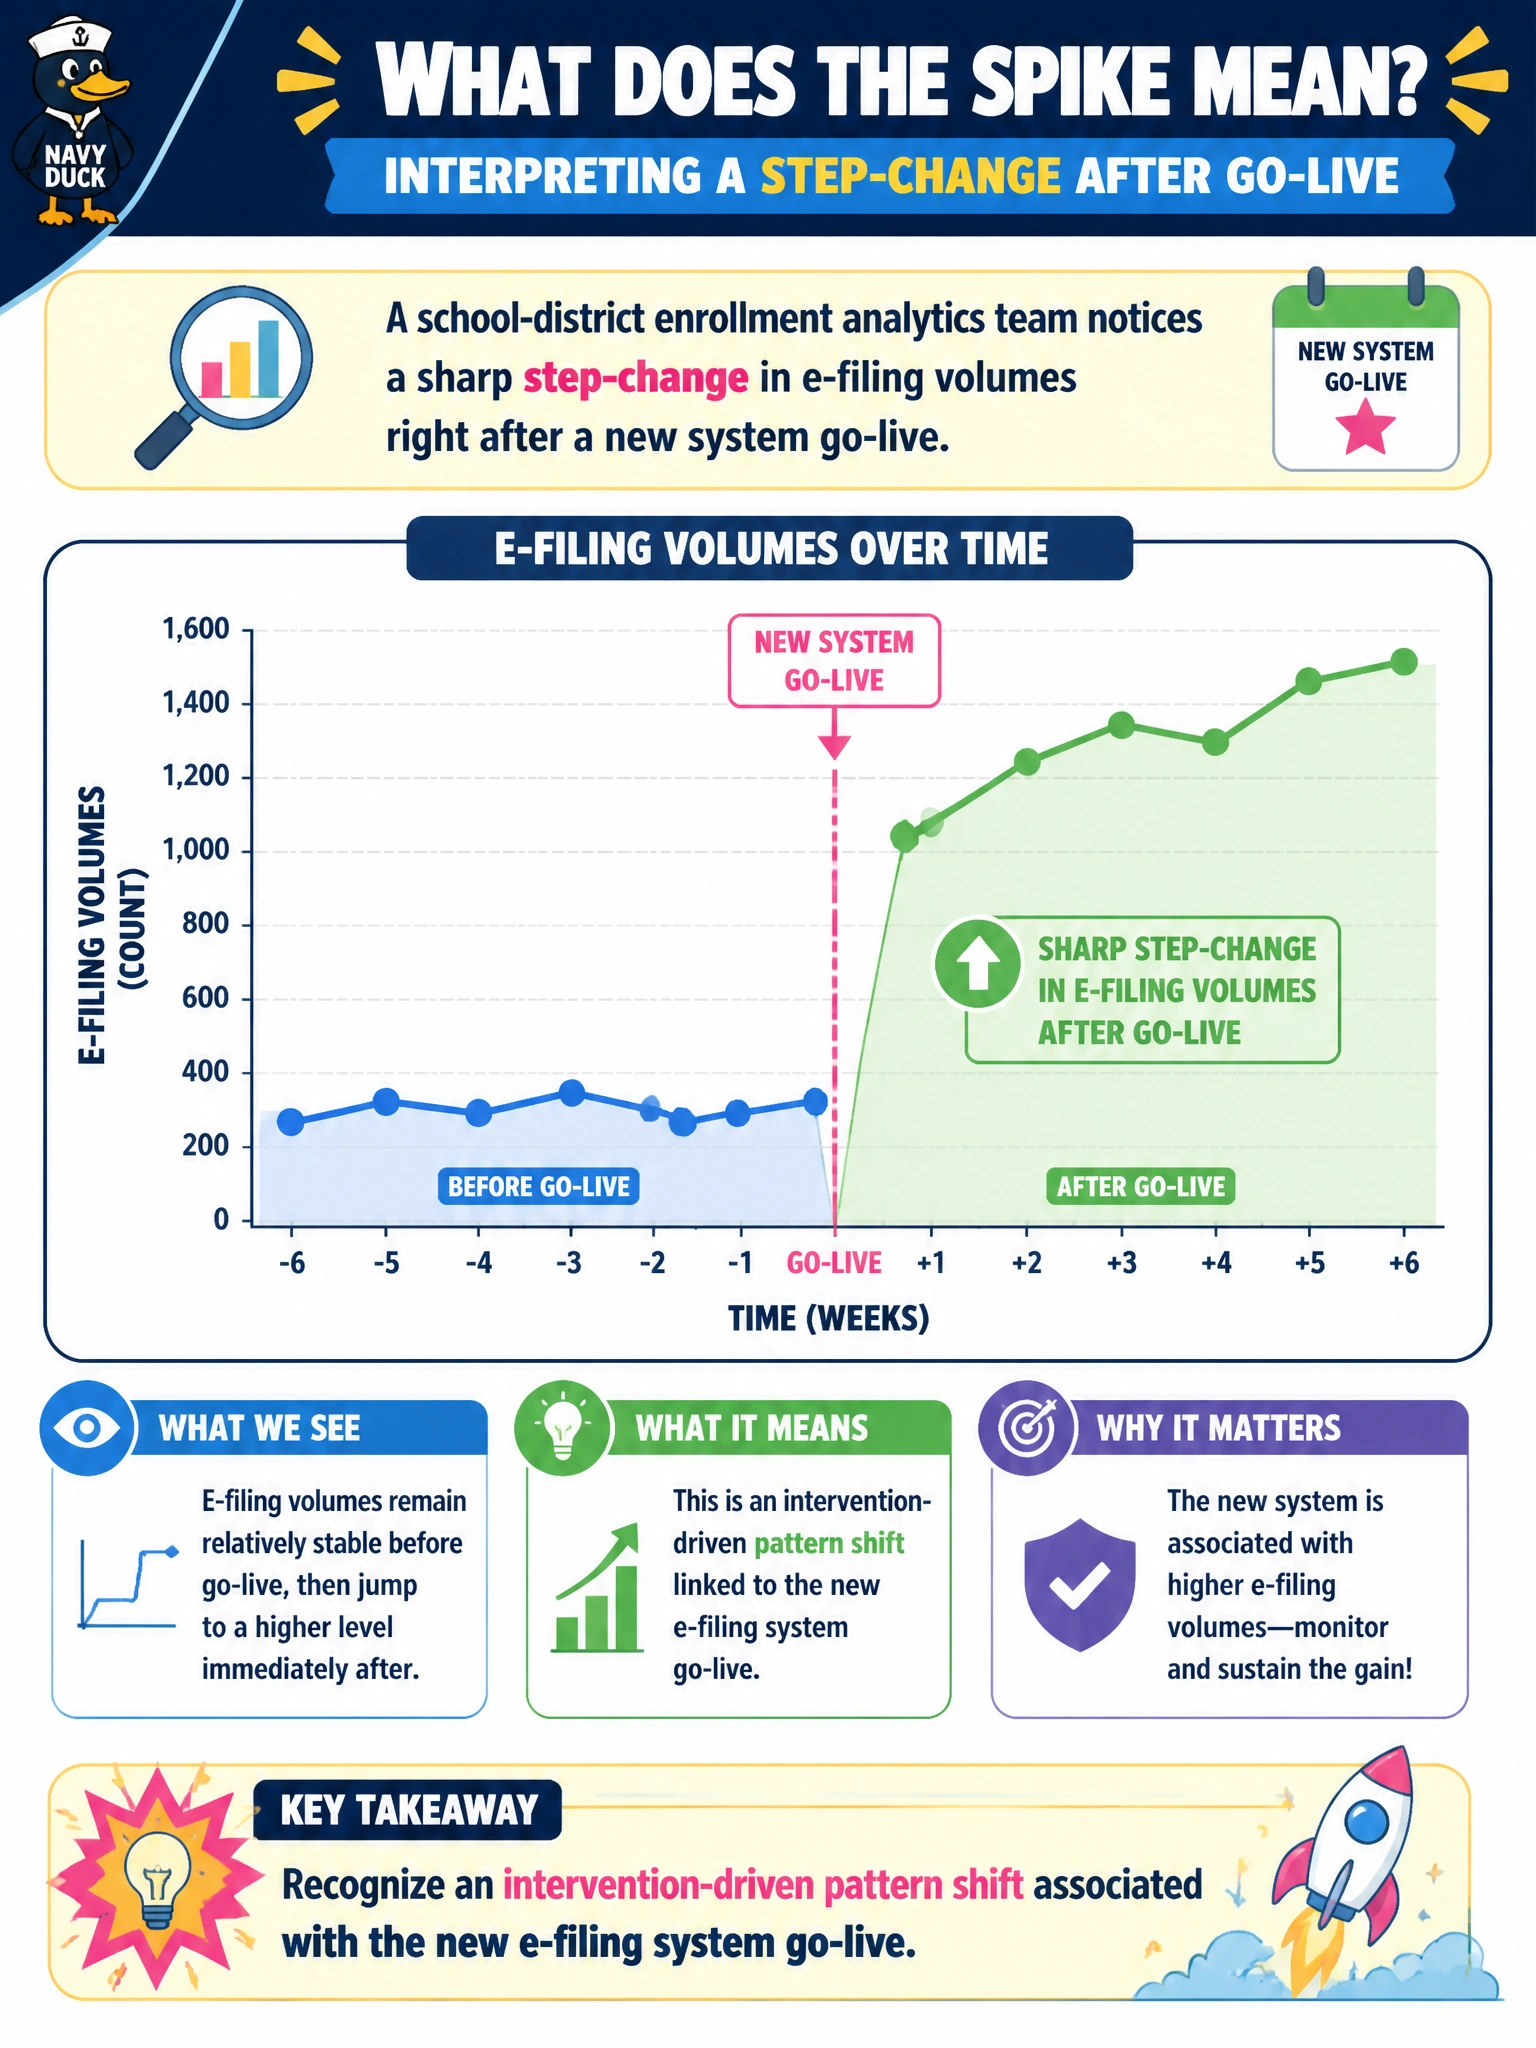
A school-district enrollment analytics team notices a sharp step-change in e-filing volumes right after a new system go-live. How should they interpret the pattern?
Select an answer to reveal the explanation.
Short Explanation
A staircase jump the day the new system lights up? That's an intervention fingerprint, not weather. Call the go-live-driven shift what it is—don't sandpaper it away or trash all history. Ops needs the before/after story.
Full Explanation
A sharp step-change in e-filing volumes right after a new system go-live is an intervention-driven pattern shift. School-district enrollment or clerk analytics should tie the discontinuity to the deployment event: new UX, mandatory e-filing, or batch backfill can jump the series overnight. Recognizing the go-live fingerprint preserves before/after operational learning and avoids misattributing the jump to unrelated seasonality.
Attributing the jump only to random seasonal weather while ignoring the go-live discards the strongest concurrent intervention signal in the stem. Assuming the step-change means all historical data must be deleted forever throws away the pre-period baseline needed for trend and impact analysis; history remains useful with proper segmentation. Smoothing the series until the step disappears so dashboards look continuous erases a real process change and misleads leadership about continuity of the metric definition.
Exam caveat: Calendar-aligned spikes after known civic system deployments are intervention shifts. Prefer recognizing the go-live association over weather-only stories, history deletion, or cosmetic smoothing.
Operational check: Annotate the go-live date on the time series, segment pre/post metrics, document any definition changes, and keep both eras visible with a clear intervention note in the enrollment dashboard.