
A parks and recreation demand desk sees poverty rate correlating with longer service delays. How should they present that relationship?
Select an answer to reveal the explanation.
Short Explanation
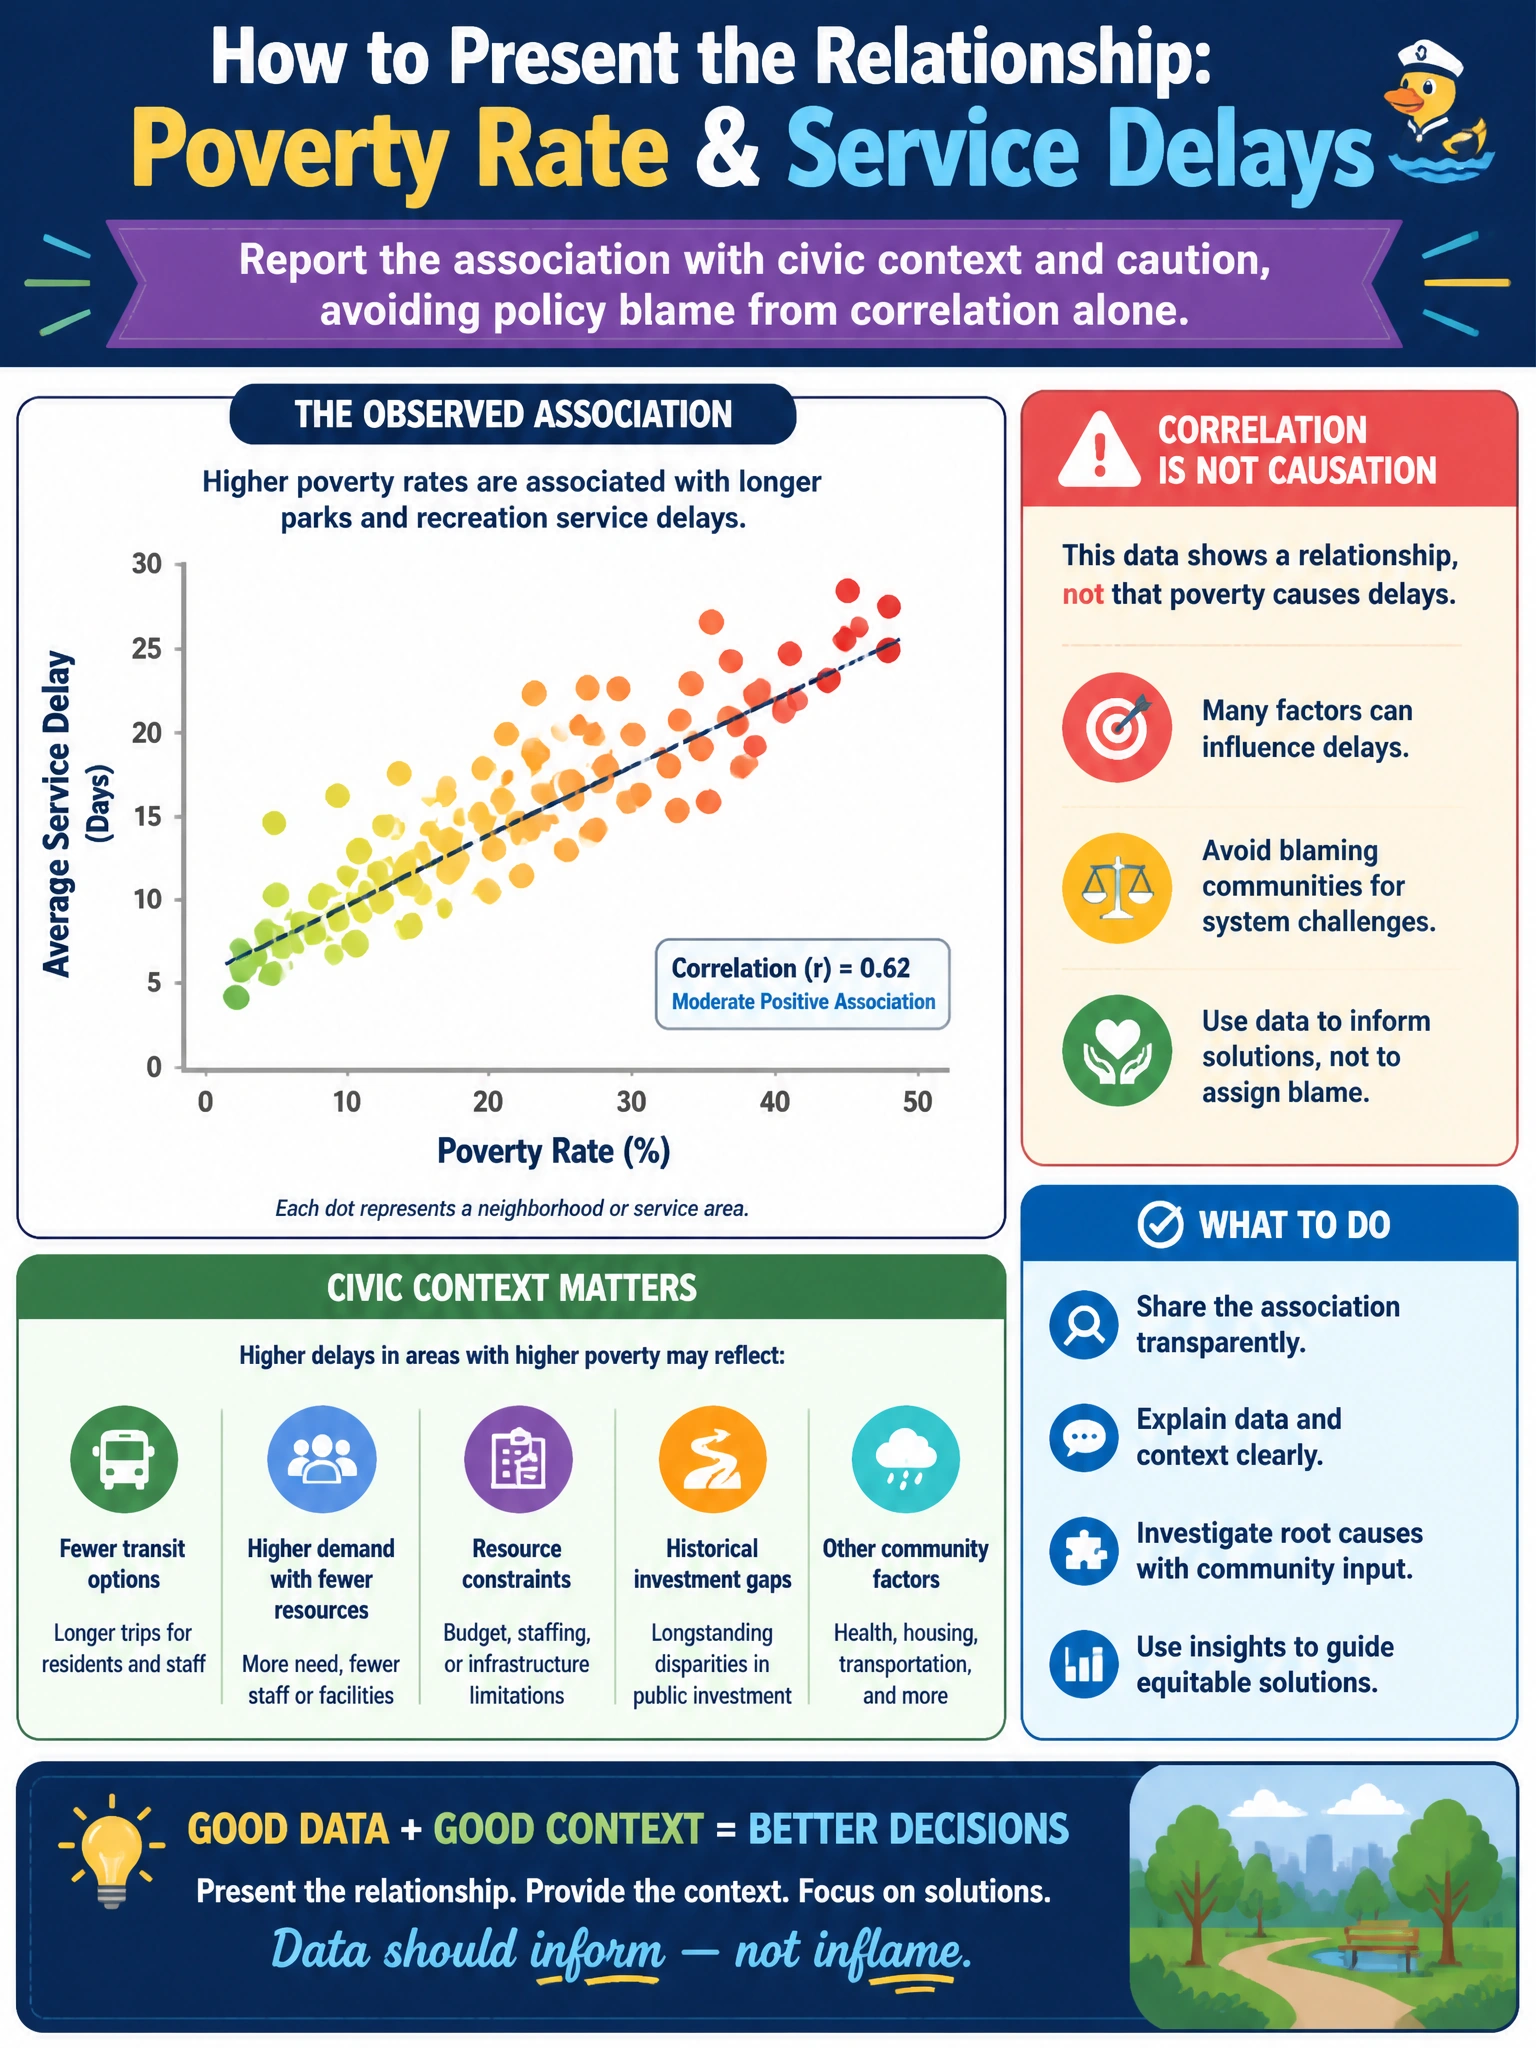
Correlation between poverty and delay is a yellow light, not a gavel. Share the association with context and caution—don't pin blame or pretend it's a full causal study. Deleting the variable just hides a pattern parks leadership still needs.
Full Explanation
A correlation between poverty rates and longer parks/recreation service delays is an important civic association: it may flag under-resourced neighborhoods, unequal routing, or demand–capacity mismatch. Domain 4 expects the demand desk to present that relationship with civic context and explicit caution—useful for prioritization discussions—without treating correlation as proof that residents 'caused' delays or as a finished causal policy evaluation.
Presenting the correlation as proof that residents in those areas caused the delays commits a blame fallacy and reverses a service-equity lens into resident fault. Deleting poverty variables so uncomfortable relationships disappear suppresses equity-relevant signal that parks leadership still needs. Treating correlation as identical to controlled causal policy evaluation overstates what descriptive association can support; causal claims need design, controls, and stronger identification.
Exam caveat: Socioeconomic–service delay associations are reportable with caution. Correct answers emphasize context and avoid both erasure of sensitive variables and leap-to-causation or blame language.
Operational check: Report the association with geography and service-type breakdowns, note confounders (fleet density, ticket mix, staffing), and recommend deeper analysis or operational pilots—never delete the variable or publish a blame narrative from correlation alone.