
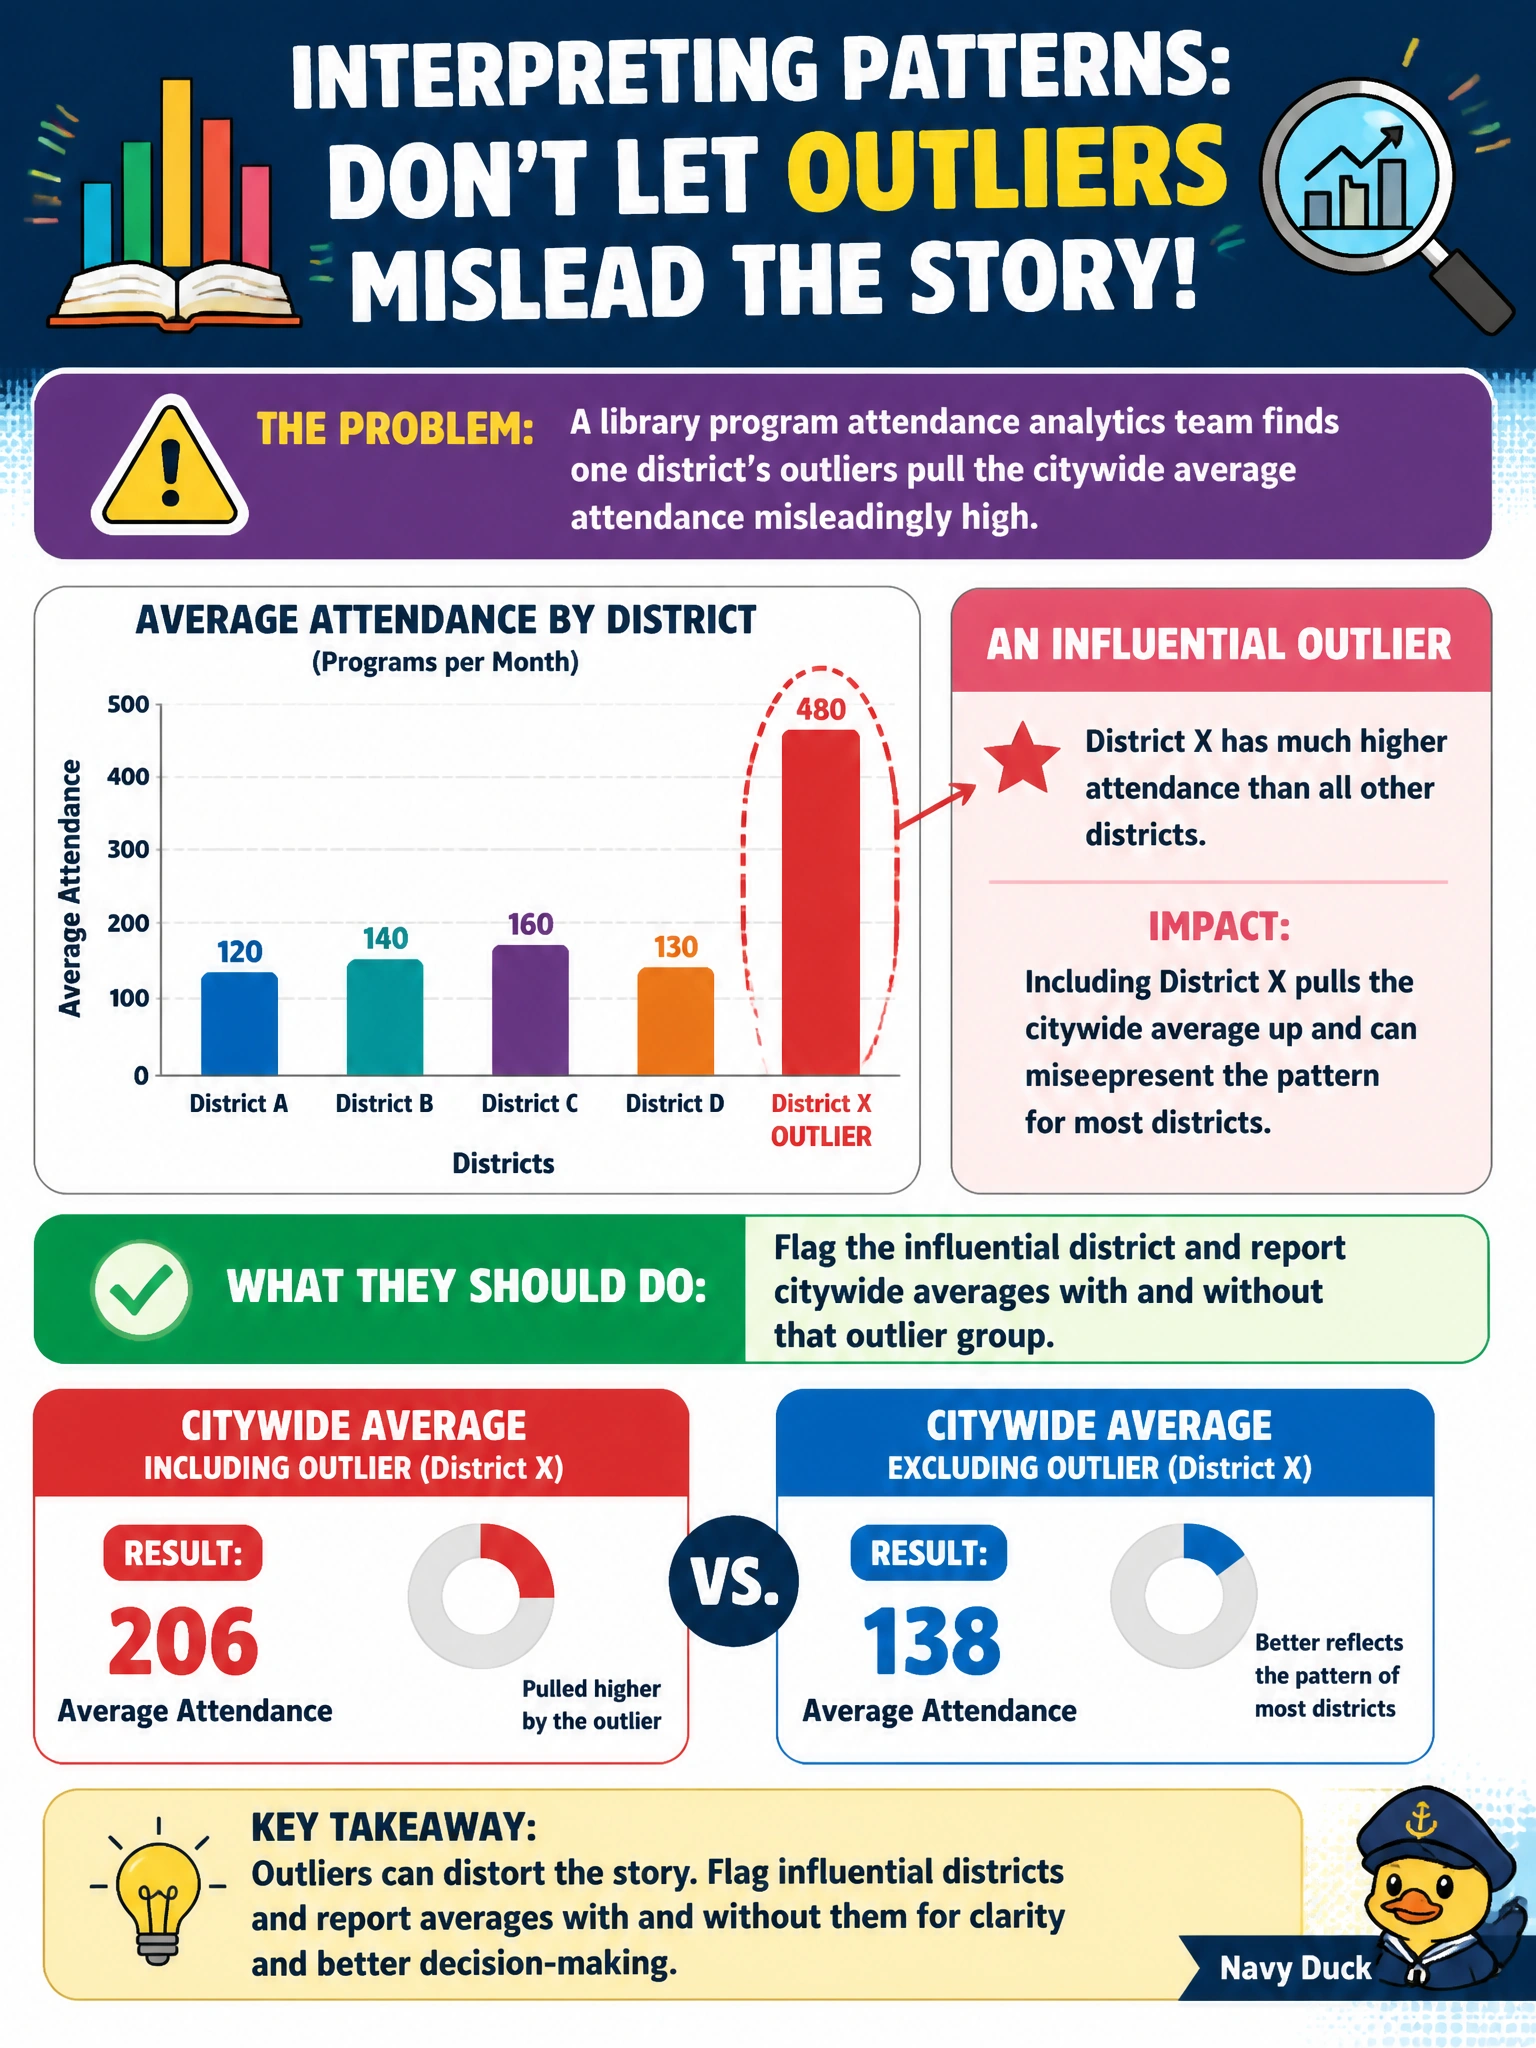
A library program attendance analytics team finds one district's outliers pull the citywide average attendance misleadingly high. What should they do when interpreting the pattern?
Select an answer to reveal the explanation.
Short Explanation
One flashy district can yank the citywide mean like a heavy kid on a seesaw. Call out the influential group and show averages with and without it. Hiding the outlier or cloning it everywhere just misleads the board.
Full Explanation
Citywide library attendance averages can be distorted by one influential district whose outliers pull the mean upward. Responsible Domain 4 interpretation flags that subgroup and reports citywide averages both with and without it so leadership sees whether the 'citywide' story is broad-based or driven by a few branches. That dual reporting preserves transparency for board packets while preventing misallocation of program resources based on a skewed mean.
Hiding the district and publishing only the inflated citywide mean conceals material influence and misleads budget and staffing decisions. Replacing every branch count with the single outlier district's value manufactures a false citywide pattern and destroys between-branch variation needed for equity analysis. Stopping all attendance metrics because averages can be imperfect abandons useful descriptive tools instead of applying standard outlier-aware reporting practices.
Exam caveat: When a stem highlights influential subgroups or outliers pulling a civic average, the correct move is disclose and dual-report—not conceal, clone, or quit publishing. Means remain valid when accompanied by robustness checks.
Operational check: Identify top influential districts (e.g., via leave-one-out means or contribution charts), publish citywide mean with and without them, and add median or branch-level distributions so council can see typical versus exceptional performance.