
A county social-services case analytics team wants to compare EMS-style response-time distributions across stations. Which plot best supports that goal?
Select an answer to reveal the explanation.
Short Explanation
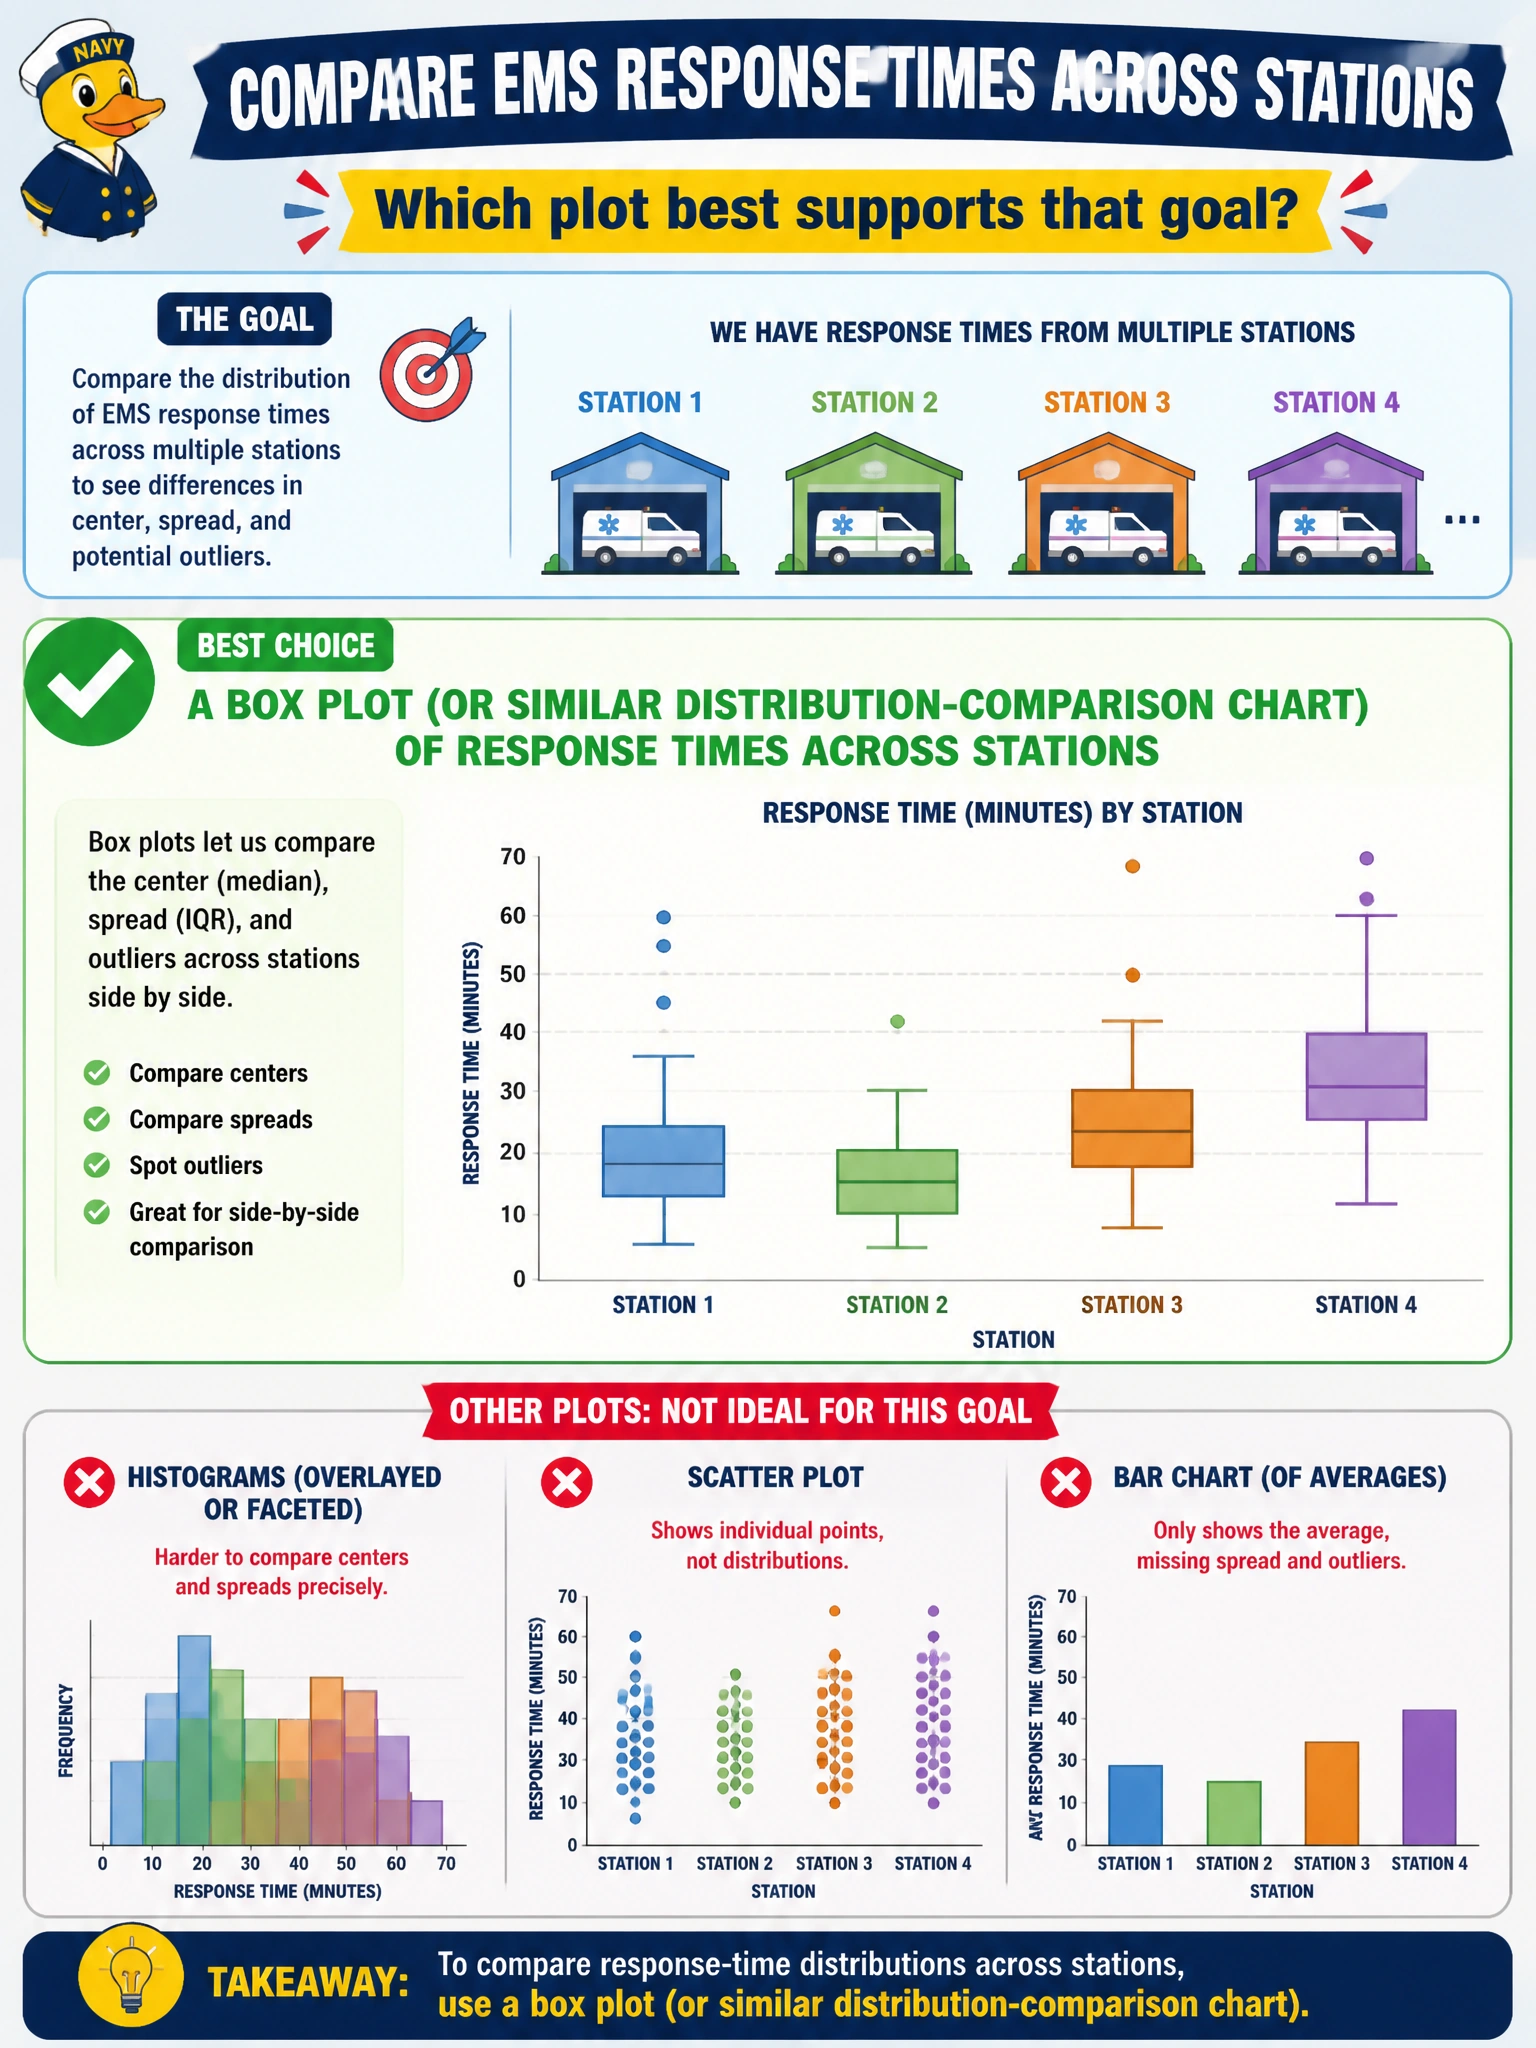
When you compare response-time distributions across stations, a box plot lets you see each station’s middle, spread, and outliers side by side. A citywide mean hides station differences, while assignment shares and budget categories don’t show response-time distributions.
Full Explanation
Comparing EMS-style response-time distributions across stations calls for a box plot (or a similar distribution-comparison chart). A box plot displays the median, interquartile range, and outliers for each station side by side, revealing typical response, spread, and tail behavior. This matters when stations have similar centers but differ in the slow tail that can drive resident harm and SLA breaches. A single citywide mean with no station breakdown erases the between-station differences the team wants to compare. A pie chart showing each station’s share of case assignments represents assignment counts, not the shape of response-time distributions. A stacked area of budget categories changes the subject to finance and cannot support station-level delay comparison. Exam caveat: when the goal is to compare distributions across groups, use a distribution-comparison chart; a citywide mean or charts of assignment shares or budget categories do not answer that question. Practical check: create response-time box plots by station with aligned y-axes, flag stations with high upper whiskers or extreme outliers, pair the plots with volume counts, and brief leadership on typical and tail performance before staffing or routing changes.