
A city planning zoning analytics team must compare simple budget-share categories for a public report. Which plot guidance should they follow?
Select an answer to reveal the explanation.
Short Explanation
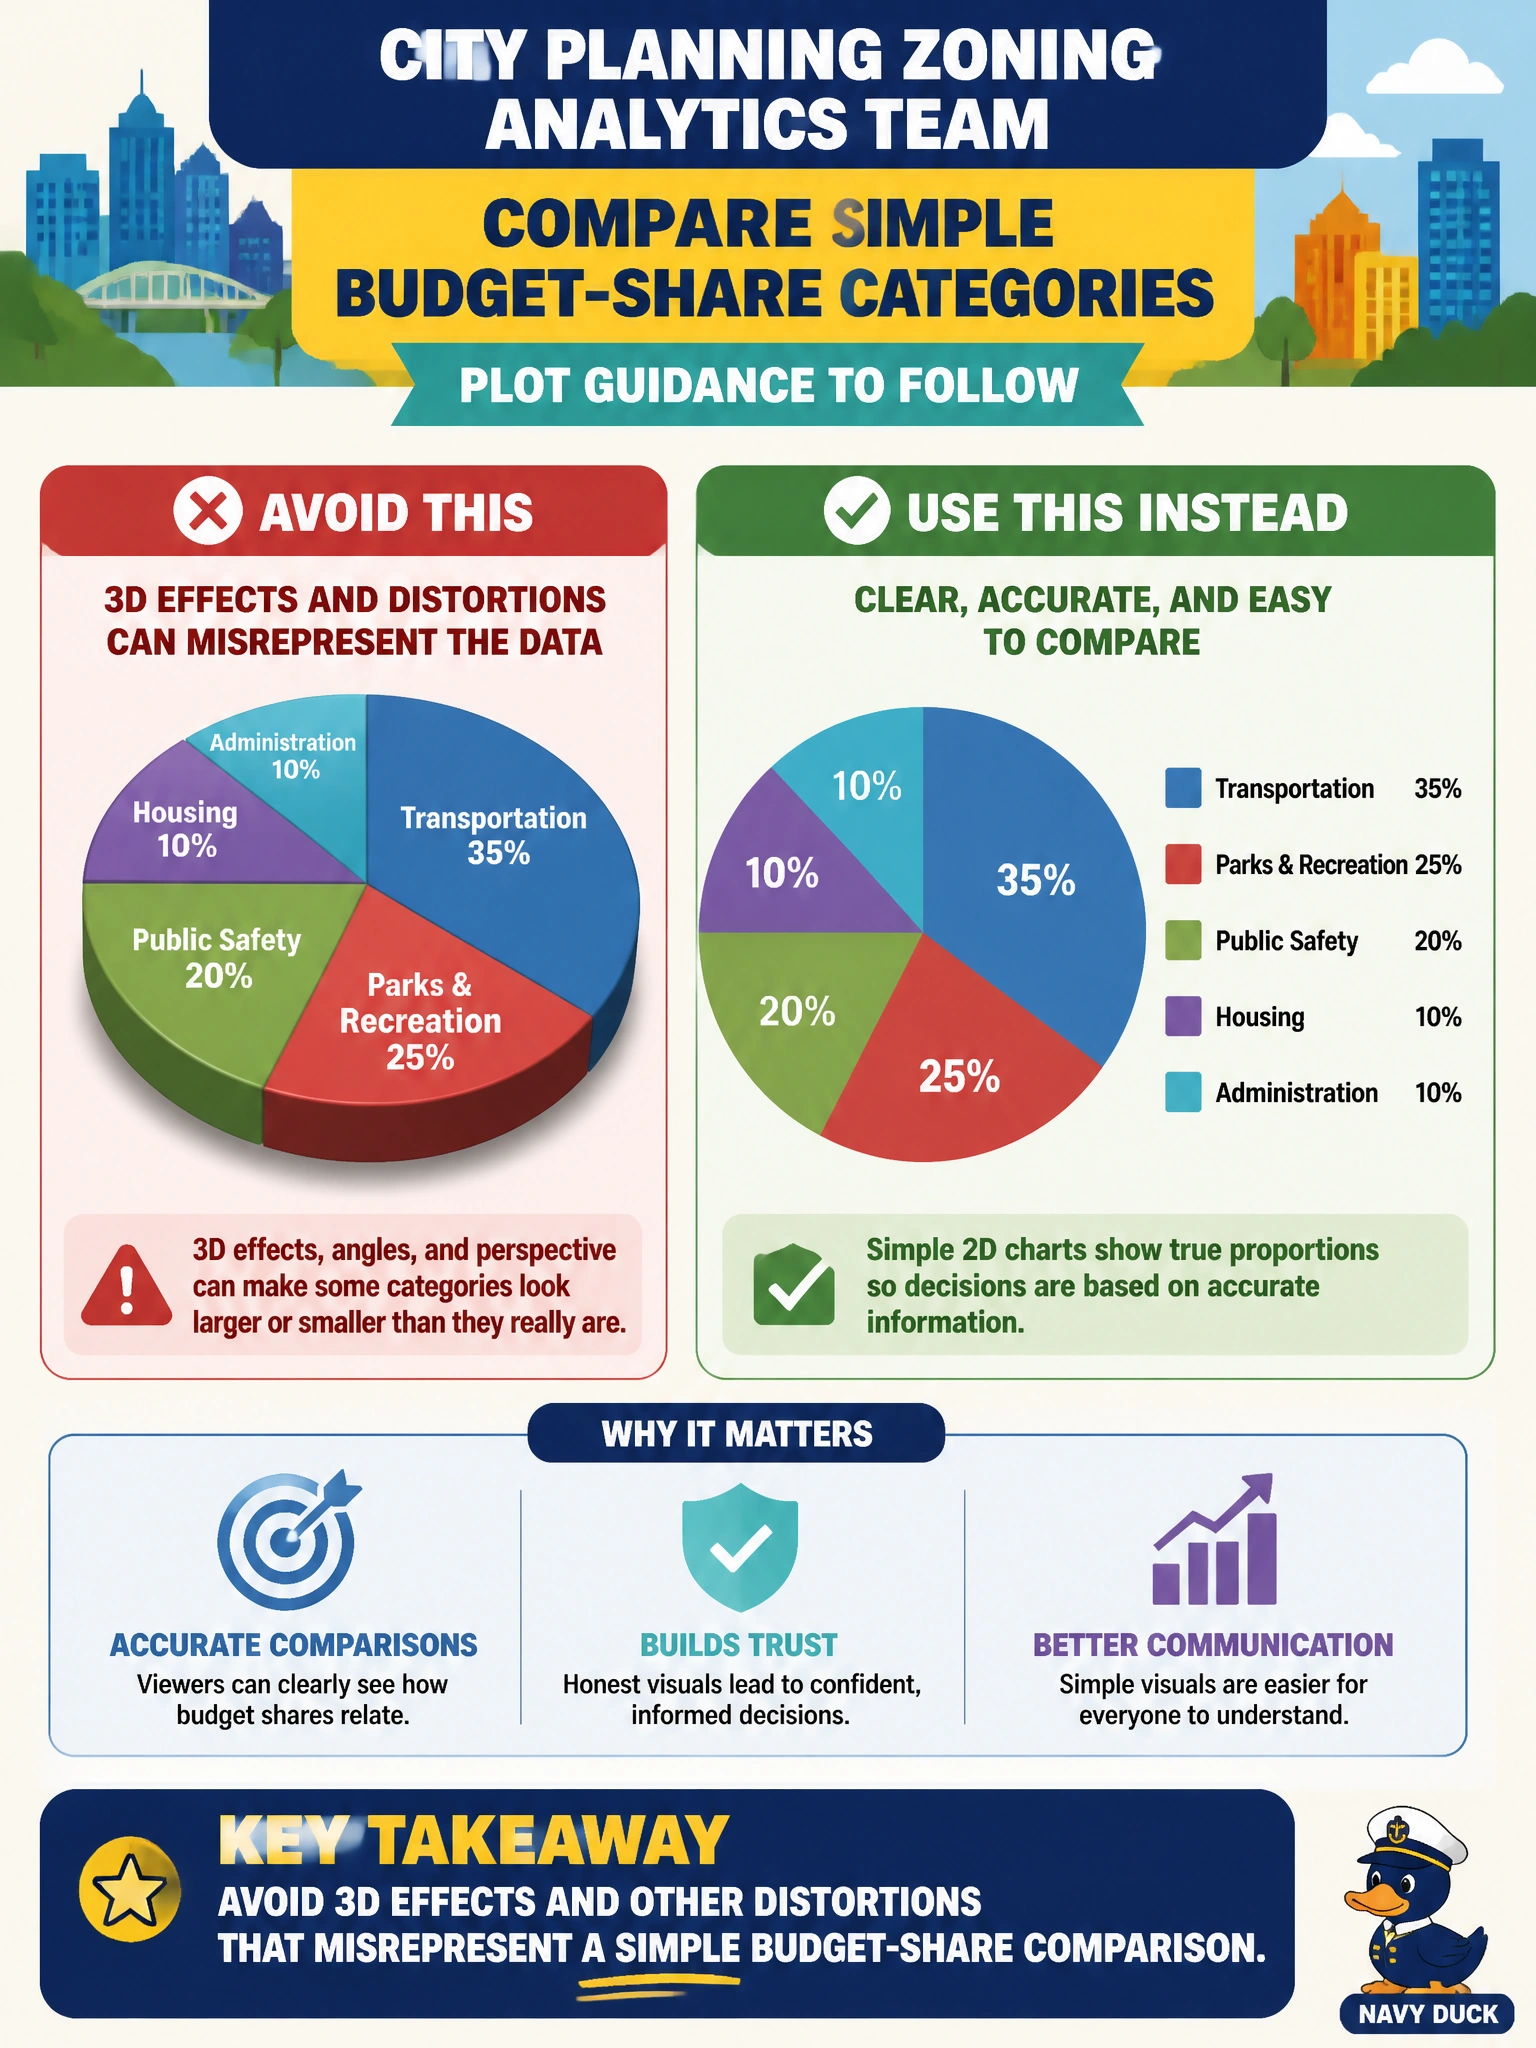
Budget-share slides go wrong fast when 3D perspective stretches the truth. Keep zoning comparisons flat, labeled, and honest. Distortion tricks might wow a room for a second and mislead council for a year.
Full Explanation
Simple budget-share comparisons for city planning and zoning public reports should avoid 3D effects and other distortions that misrepresent magnitudes. Accurate share communication depends on honest lengths, areas, or clearly labeled percentages—not perspective tricks that make smaller slices look larger on the slide. Visualization integrity is part of descriptive analysis whenever civic numbers inform public debate, council votes, or budget hearings.
Adding extreme 3D perspective so smaller shares look larger is deliberate distortion and fails both analytic practice and public-report ethics. Dual truncated axes that exaggerate tiny differences without noting the scale break mislead readers about practical significance and invite false urgency. Replacing labeled shares with decorative clip art that has no numeric encoding abandons quantitative visualization and leaves the public unable to verify the claimed mix.
Exam caveat: prefer non-distorting 2D encodings for share comparisons; 3D effects, silent truncated dual axes, and clip-art substitutes are classic wrong answers. Operational check: render flat bars or a simple 2D share chart with explicit percentages, keep a zero baseline for bars, disclose total budget dollars and fiscal year, and peer-review the slide for axis tricks before the zoning report is published.