
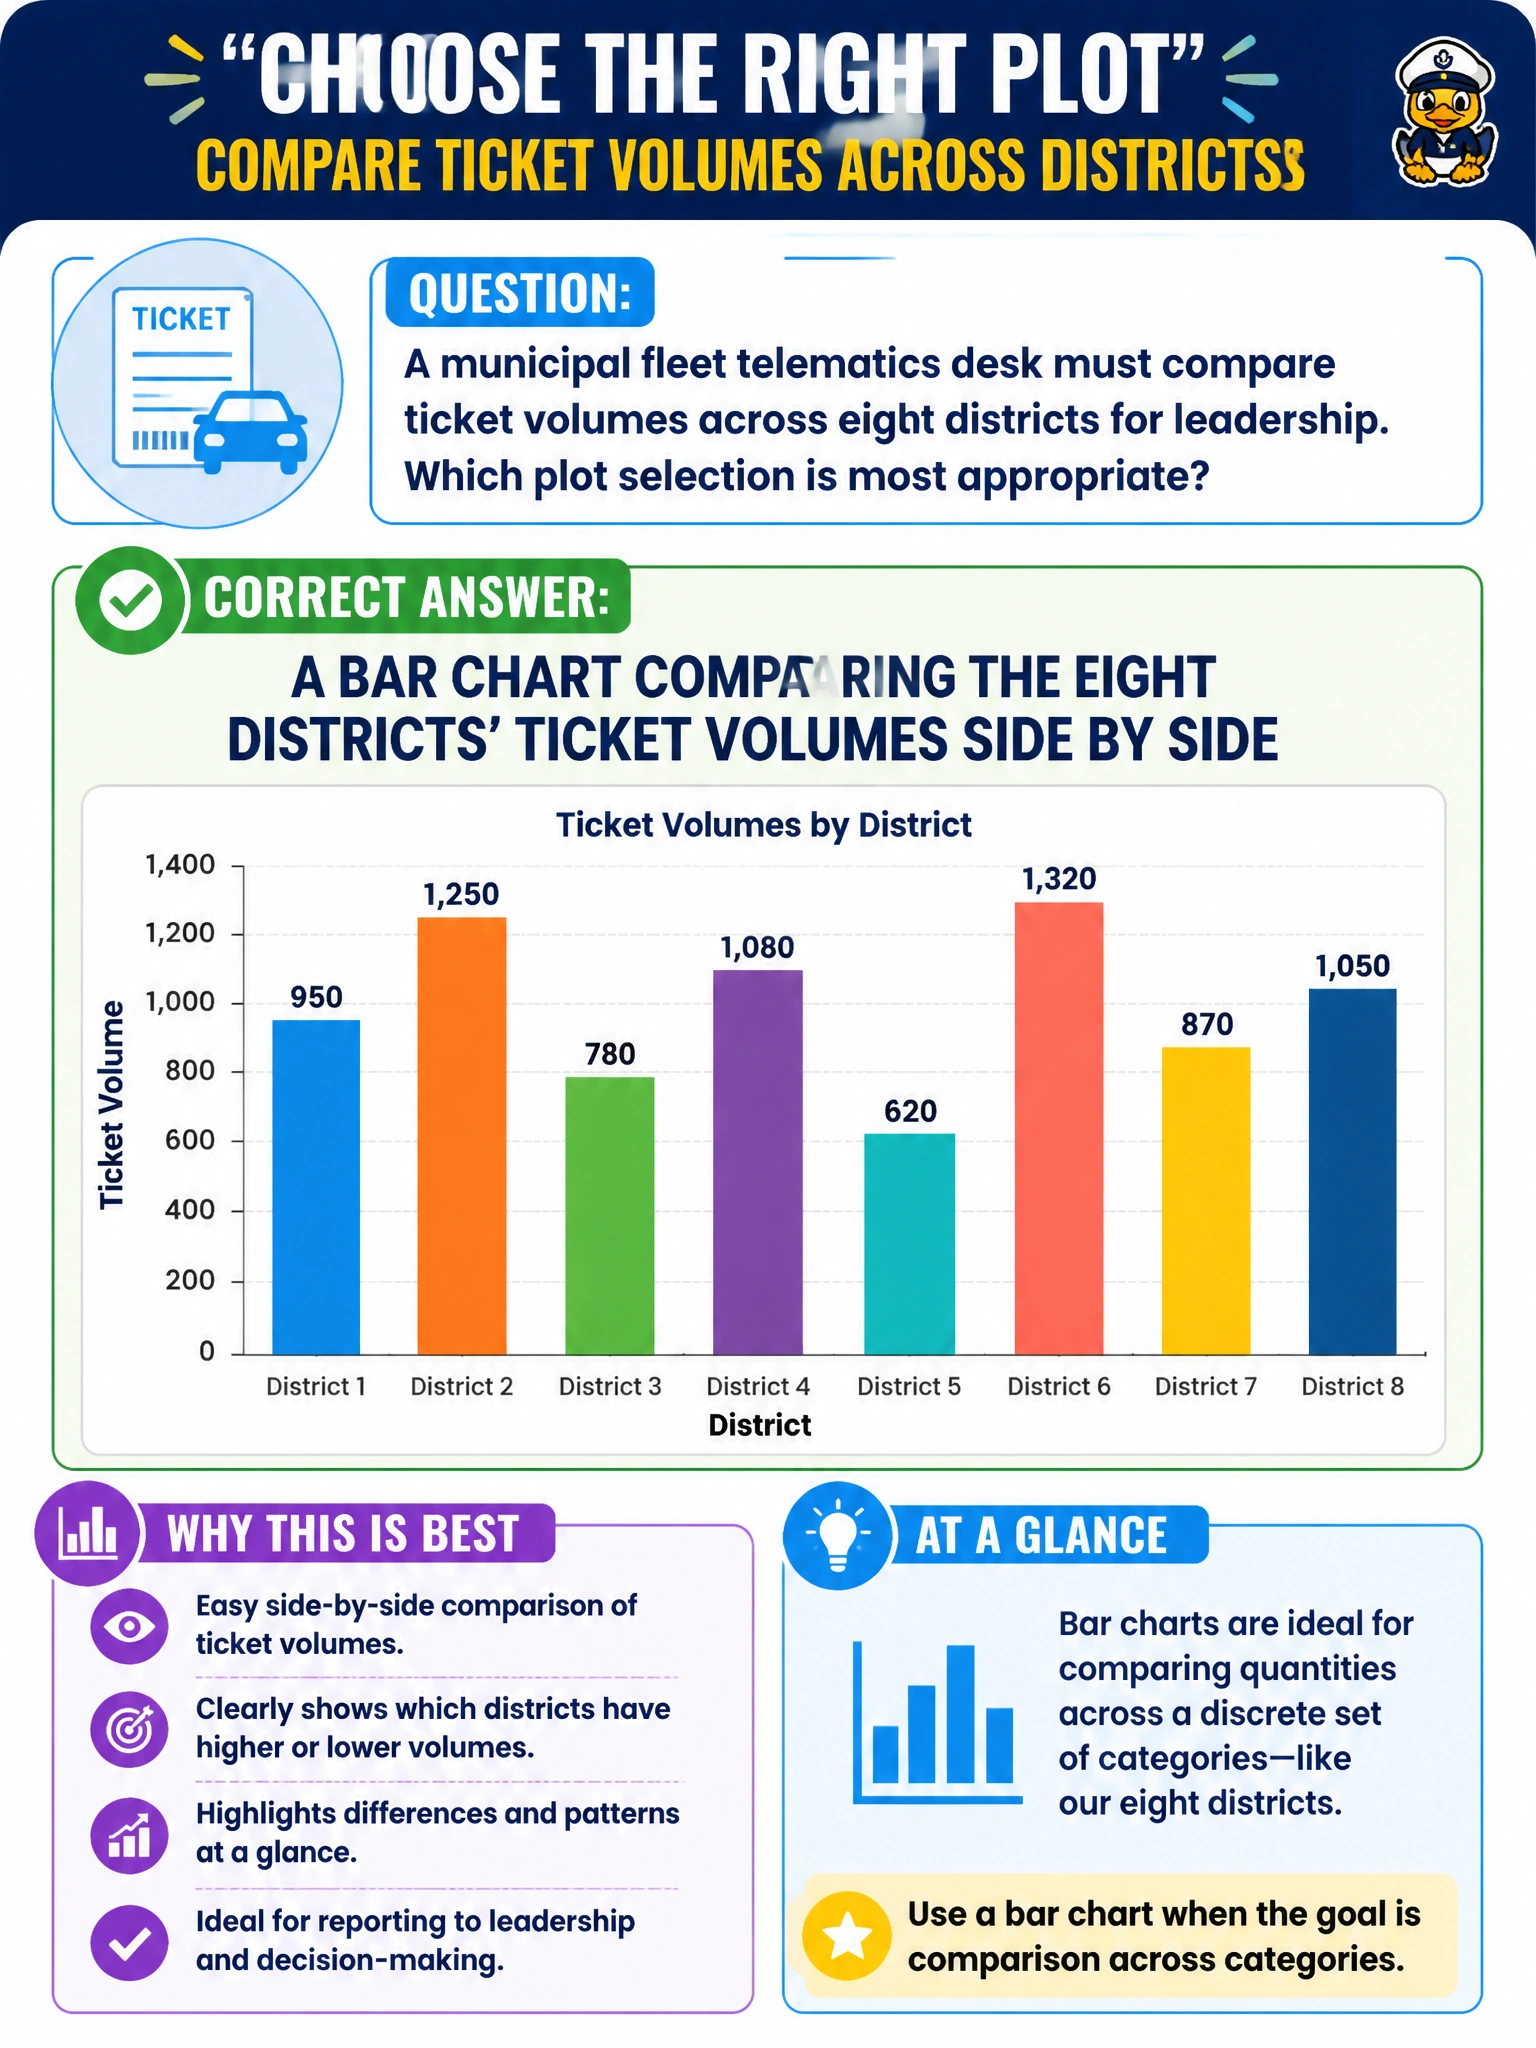
A municipal fleet telematics desk must compare ticket volumes across eight districts for leadership. Which plot selection is most appropriate?
Select an answer to reveal the explanation.
Short Explanation
Comparing eight districts’ ticket piles? Bars beat pies—eyes judge bar length faster than pizza-slice angles. Fleet telematics leadership gets a clearer categorical comparison that way. Fake time axes and mystery radars just muddy the ranking.
Full Explanation
Comparing ticket volumes across eight fleet-telematics districts for leadership is a categorical magnitude comparison best served by a bar chart with districts side by side. Human perception judges aligned bar lengths more accurately than angles or areas, so ranking and gap-reading across a modest number of similar civic categories stays reliable. Bar charts are the default honest choice when municipal operations need a clear, comparable view of which districts generate more tickets in the same period.
A multi-slice pie chart across eight similar categories makes near-ties hard to compare and wastes cognitive effort on angle decoding instead of ranking. A continuous line chart that invents a time axis the comparison does not have fabricates temporal structure and invites false trend reading when the question is cross-sectional. A radar chart with unlabeled axes as the only view obscures scale and is poorly suited to precise cross-district volume ranking for leadership accountability.
Exam caveat: many-category magnitude comparison → bars; avoid pies for similar slices and avoid inventing time axes. Operational check: sort districts by ticket volume, use a zero baseline, label values, keep flat 2D bars, state the date filter and ticket definition from the telematics extract, and let fleet leads verify totals against the source warehouse before the leadership pack ships.