
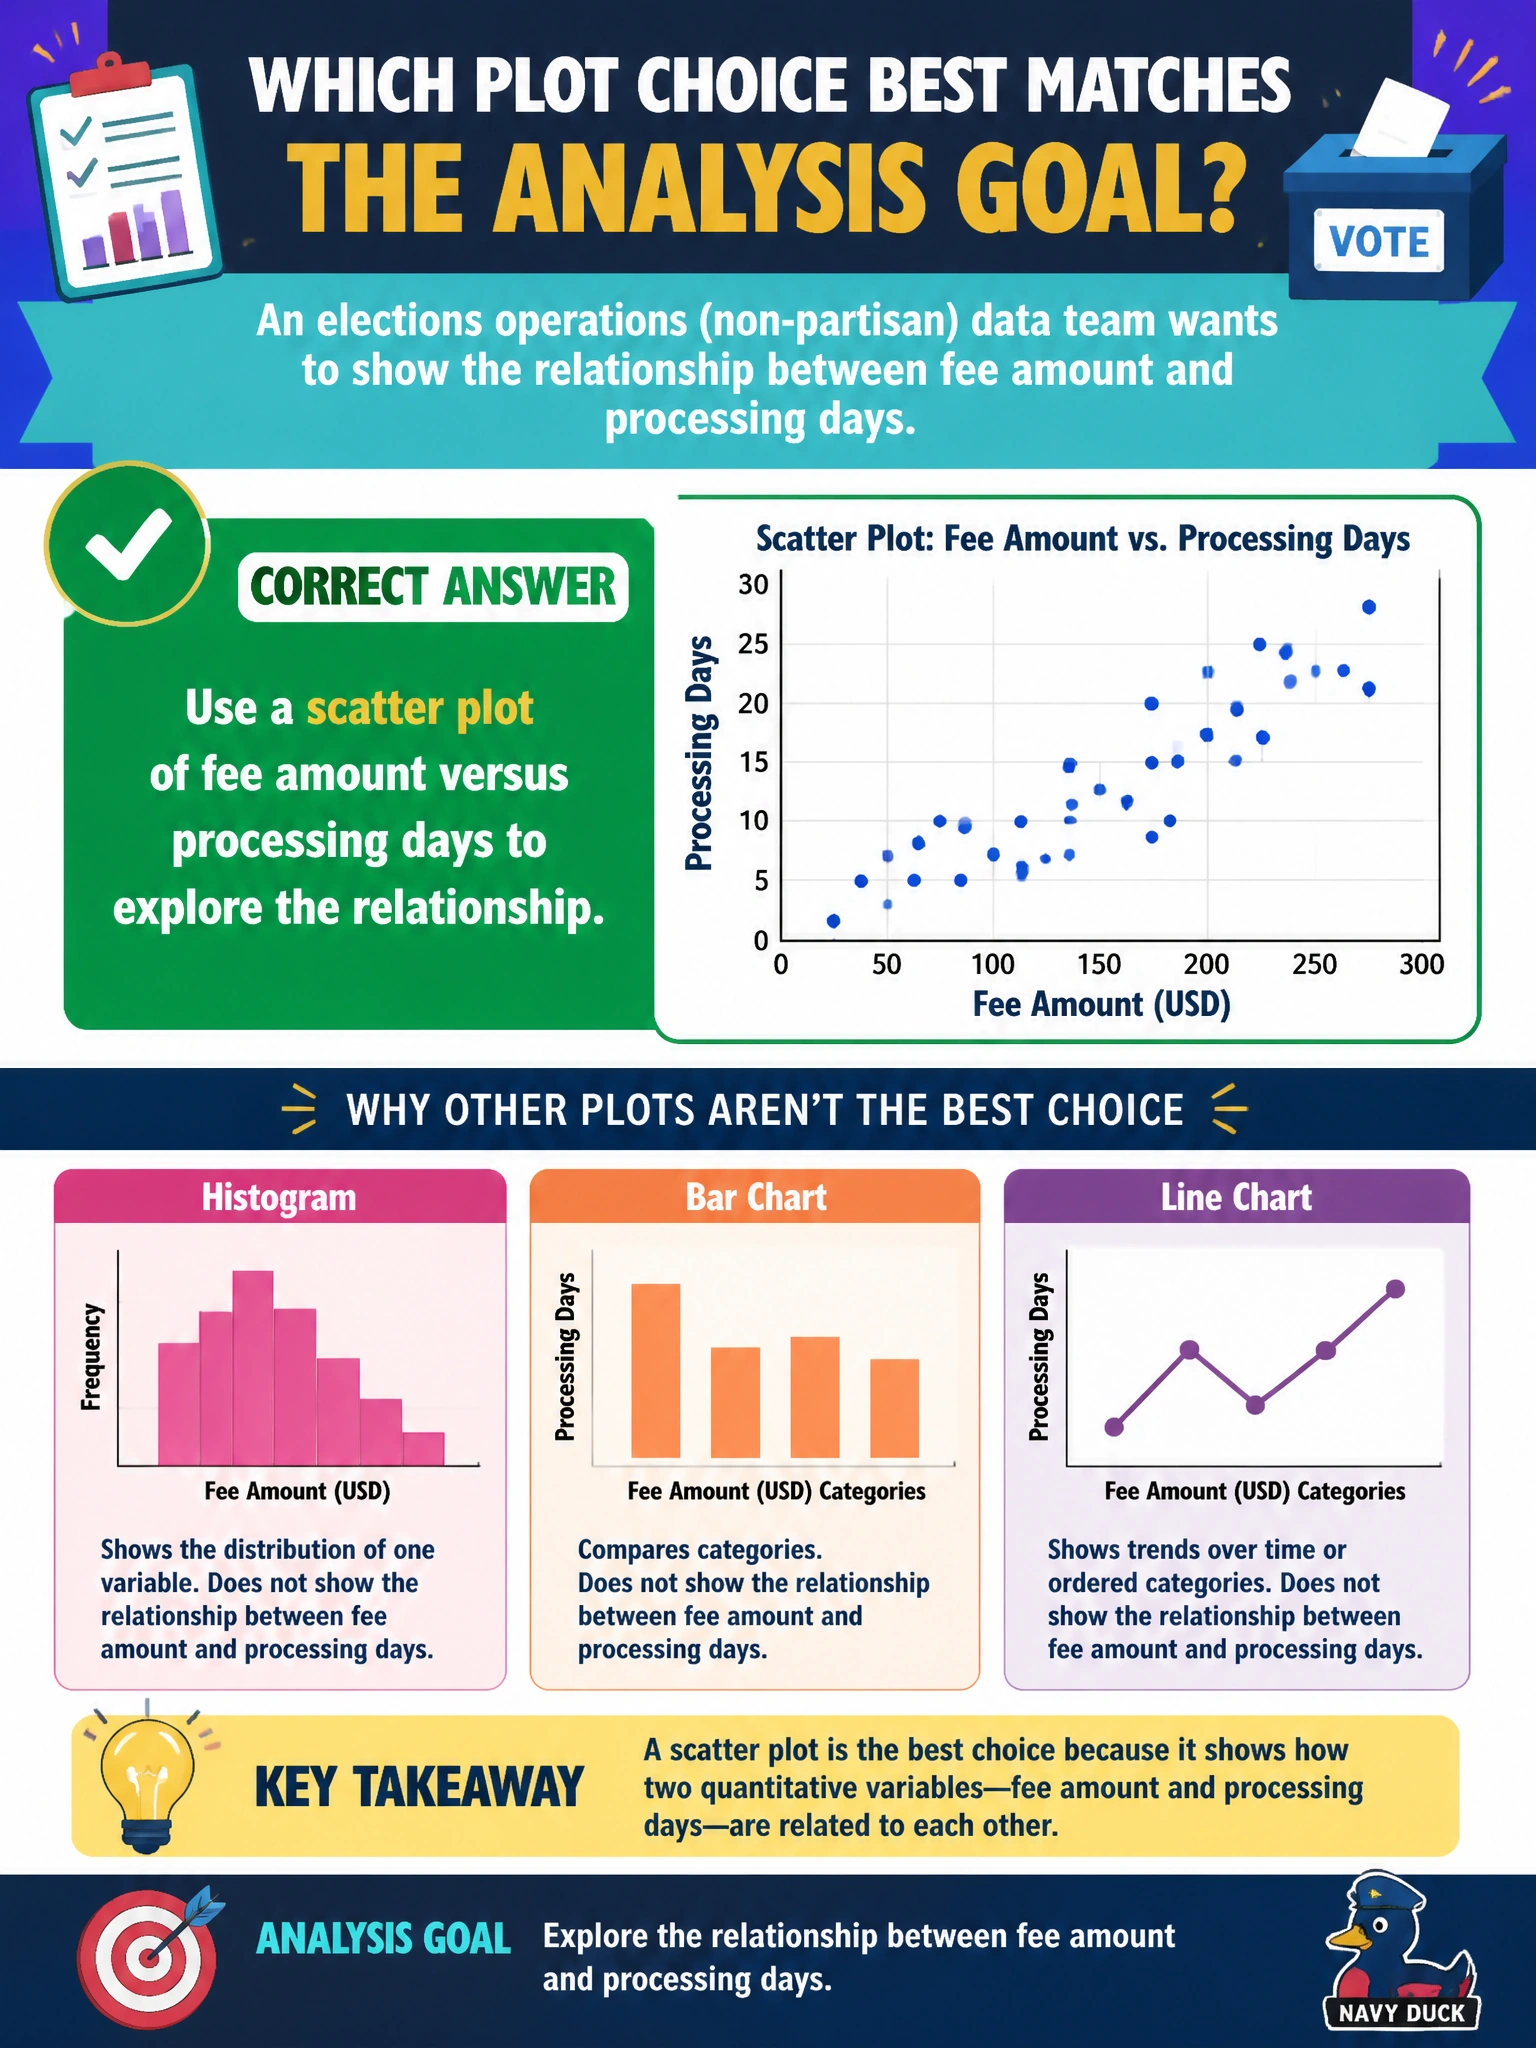
An elections operations (non-partisan) data team wants to show the relationship between fee amount and processing days. Which plot choice best matches that analysis goal?
Select an answer to reveal the explanation.
Short Explanation
Two numeric knobs—fee amount and processing days—want a scatter so you can see the cloud of points. Pies and random maps won’t show that relationship for elections ops. Match the plot to the question: relationship → scatter.
Full Explanation
Exploring the relationship between two numeric municipal variables—fee amount and processing days for elections operations—calls for a scatter plot. Scatter plots show joint variation, possible correlation, nonlinearity, and outlier clusters without forcing an artificial categorical share structure. Matching plot type to the analysis goal (relationship between two continuous fields) is the descriptive-visualization skill being tested.
A single pie chart that mixes fees and days into unrelated slices cannot represent bivariate numeric association; pies encode parts of a whole for one categorical breakdown. A table of candidate names with no fee or timing fields omits the measured variables entirely and answers a personnel question instead. A map of continents unrelated to local processing metrics introduces misleading geography and ignores the actual fee-versus-days data.
Exam caveat: bivariate numeric relationship → scatter; do not force pies/maps when the question is association between two quantities. Operational check: plot fee amount vs processing days, optionally color by submission channel, compute a correlation as a supplement (not a substitute for the plot), investigate outliers with elections ops, and document whether fees associate with slower processing before recommending process changes.