
A public hospital district throughput desk refreshes weekly visual packs for leadership. Which approach best uses accelerated descriptive analysis behind those visuals?
Select an answer to reveal the explanation.
Short Explanation
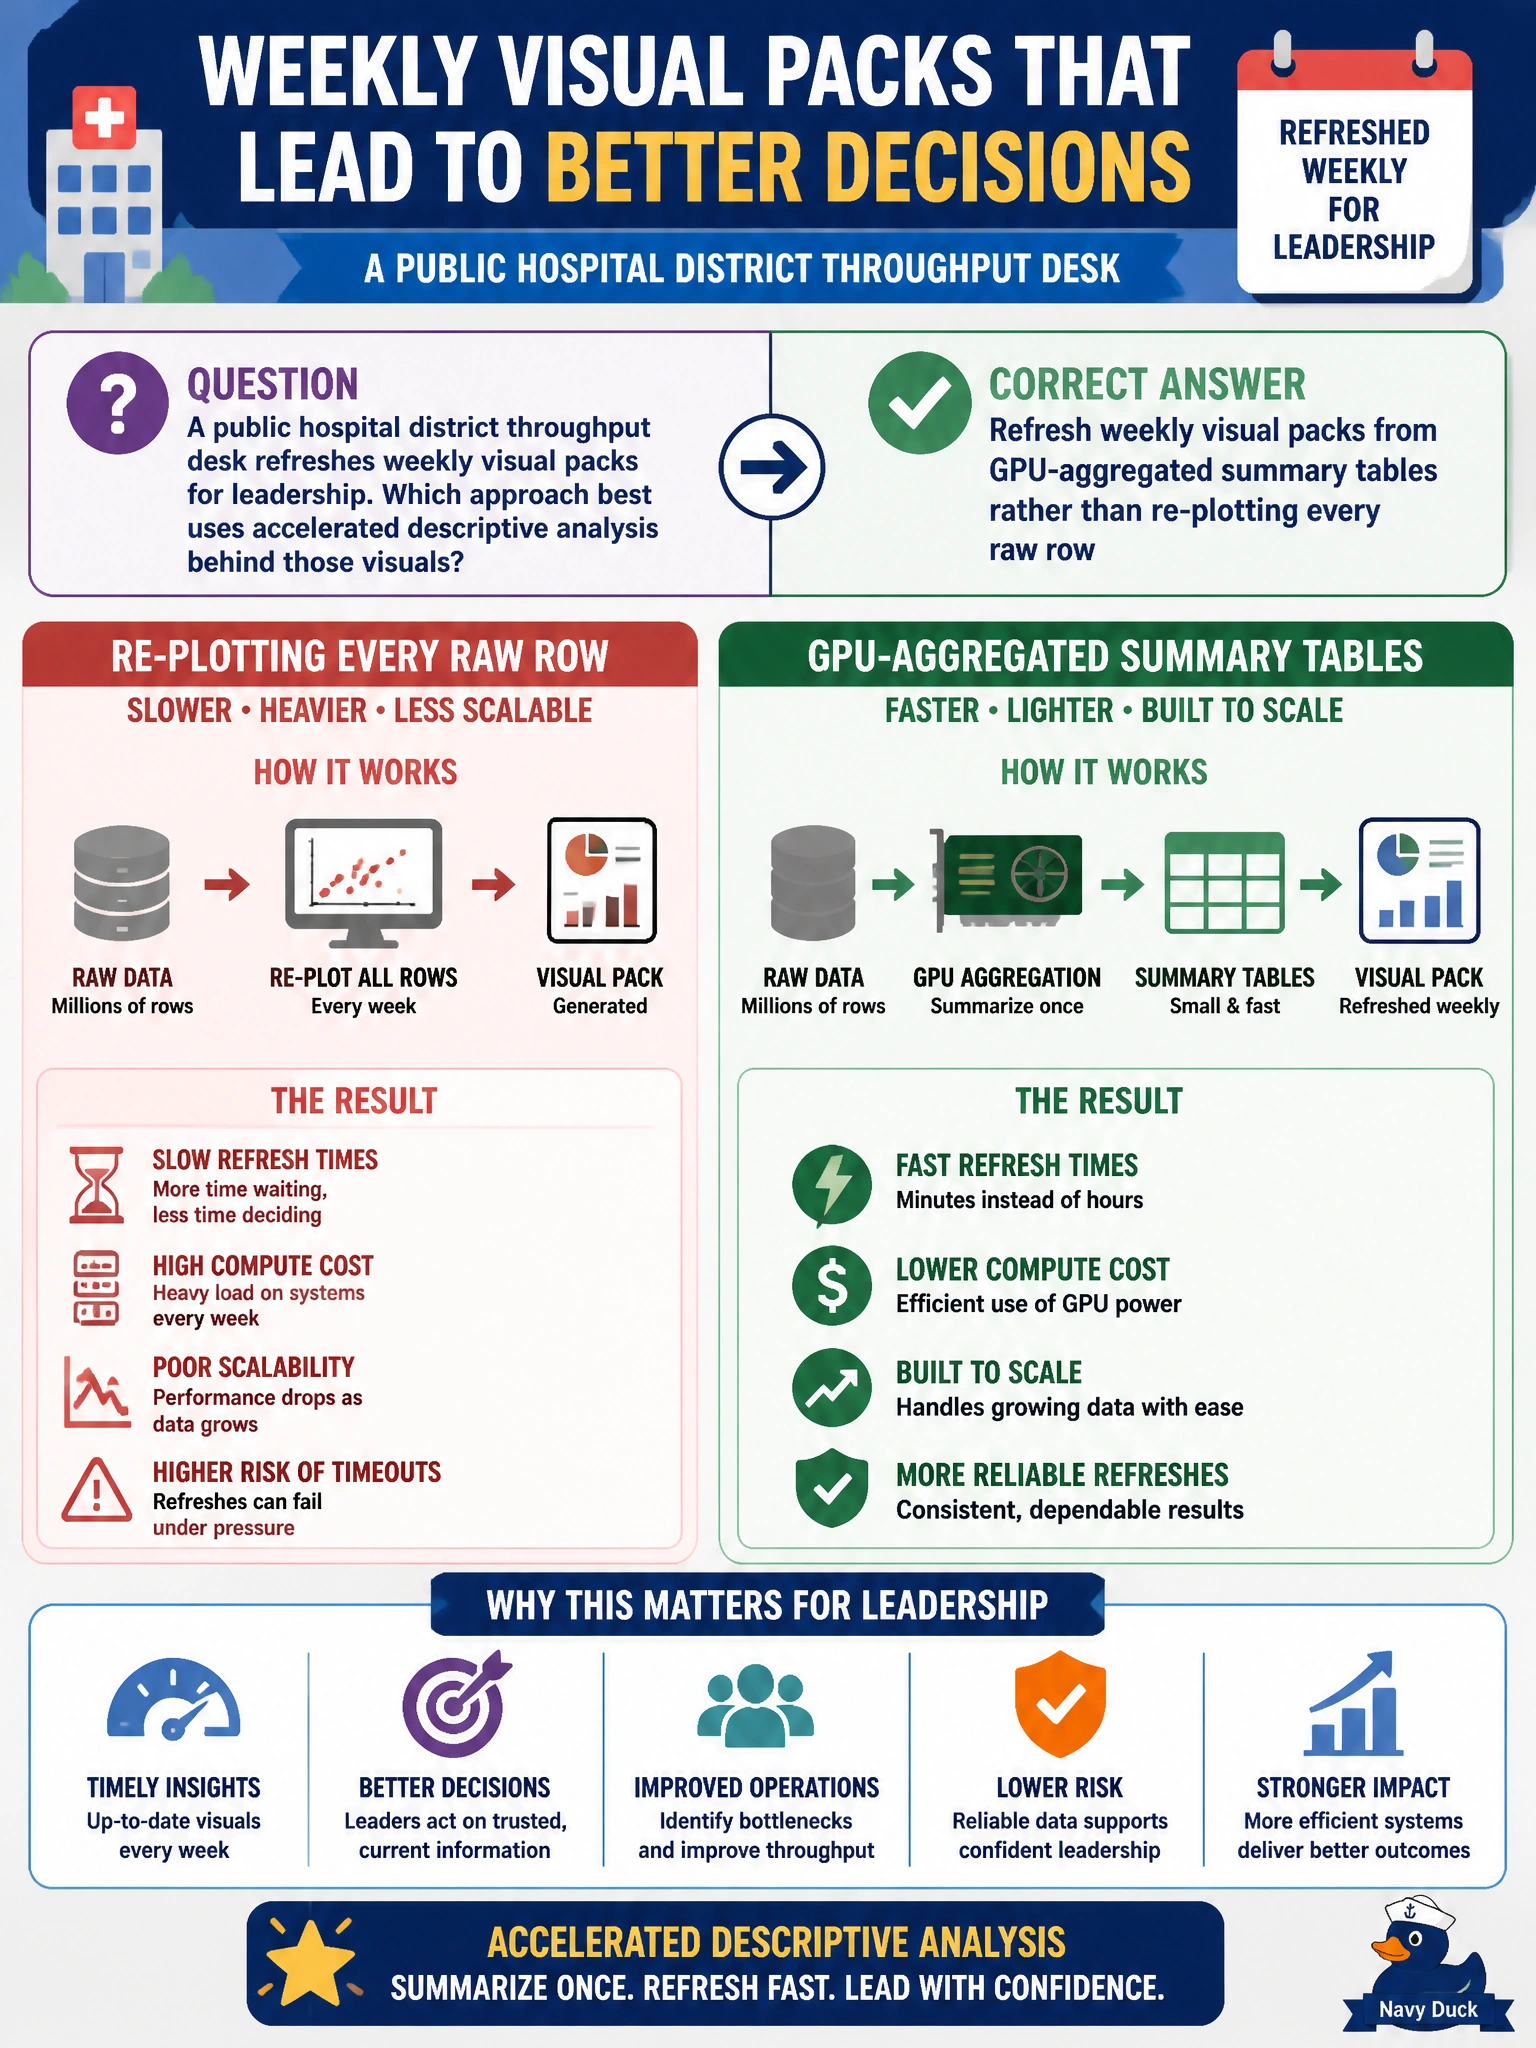
Weekly leadership packs should drink from GPU summary cups, not re-chew every raw hospital row. Aggregate on the accelerator, then refresh the charts from those summaries. Hand-copy binders and pixel-by-pixel raw scans won’t keep Monday cadence.
Full Explanation
Weekly leadership visual packs for a public hospital district should refresh from GPU-aggregated summary tables rather than re-plotting every raw encounter row. Accelerated descriptive analysis separates heavy aggregation (GPU group-bys into census of throughput metrics) from lightweight chart rendering against those summaries. That pattern keeps Monday packs reproducible, fast, and consistent with the warehouse definitions clinicians already trust.
Re-scanning every raw encounter row on a laptop CPU for each chart pixel every Monday does not scale and couples visualization latency to full-table scans. Hand-copying numbers from printed binders into slides with no reproducible aggregate step introduces transcription error and destroys auditability. Skipping aggregation and pasting unsorted extracts into presentation software leaves leadership with non-summarized noise and non-repeatable builds.
Exam caveat: accelerated viz workflows aggregate first (often on GPU), then chart summaries—not raw-row pixel pipelines or manual binder copy. Operational check: materialize weekly GPU summary tables (encounters, LOS, throughput by unit), version them, point the visual pack generator at those tables, and diff metric totals against the prior week before publishing to leadership.