
A fire/EMS response-time analytics team is designing severity visuals for inspectors who must read status quickly. Which visualization principle should guide them?
Select an answer to reveal the explanation.
Short Explanation
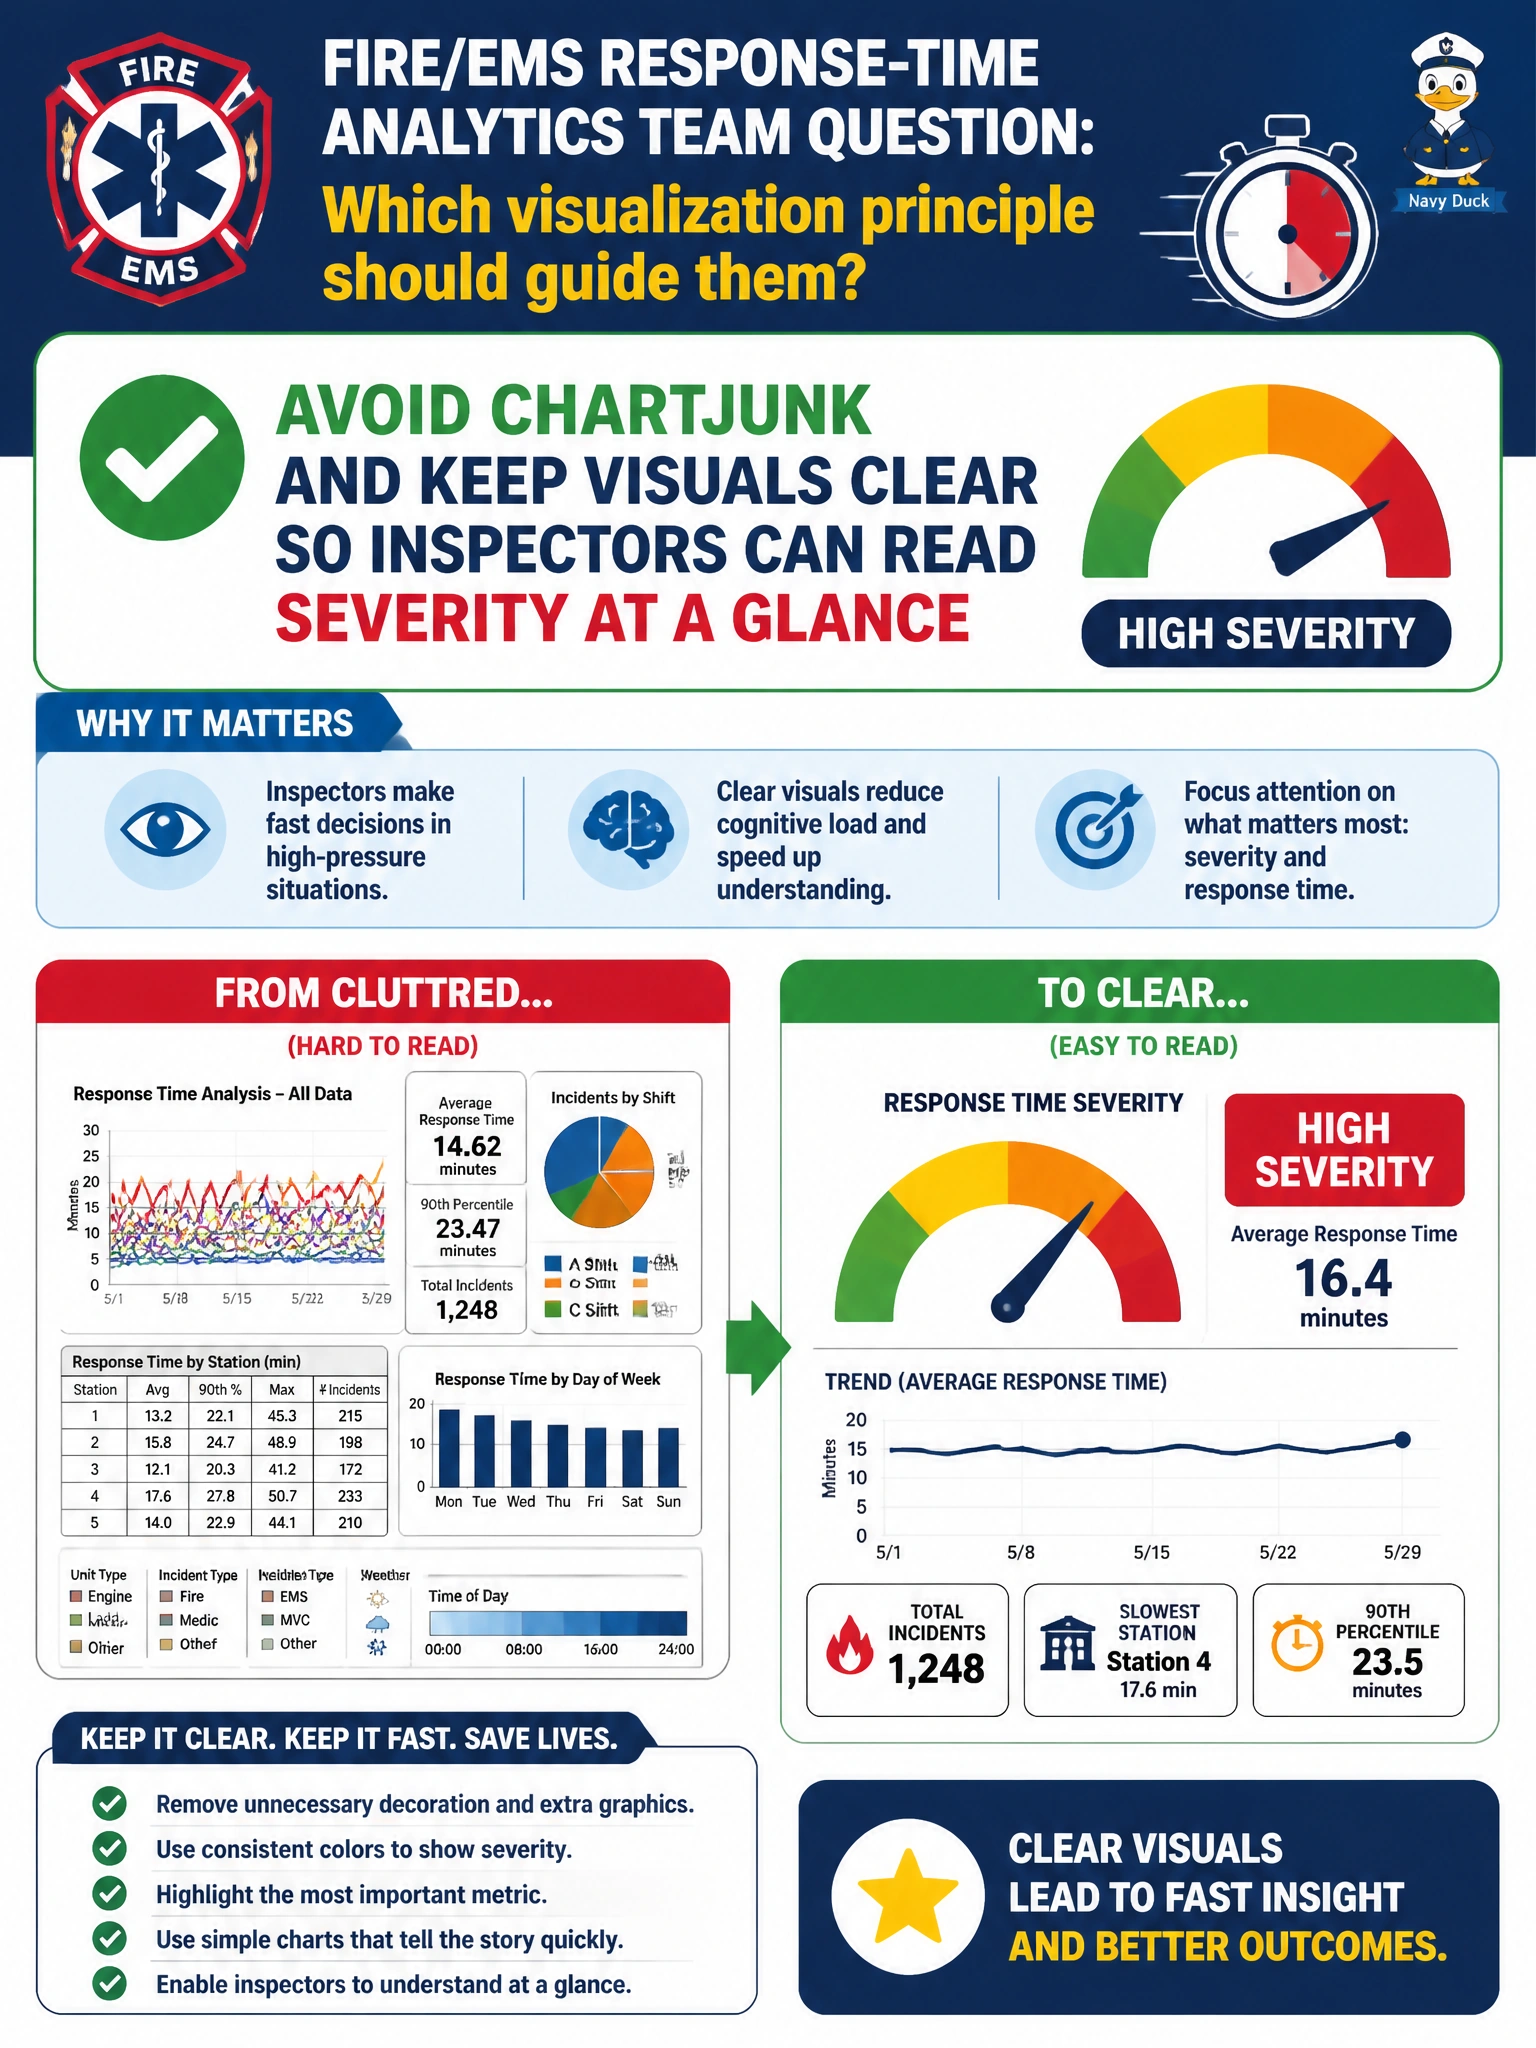
Inspectors in a hurry don’t need 3D glitter—they need severity that reads in a second. Keep fire/EMS charts clear and ditch the chartjunk. Fancy decoration that hides the signal is the wrong kind of exciting.
Full Explanation
Fire/EMS severity visuals for inspectors who must read status quickly should avoid chartjunk and keep encoding clear. Under time pressure, decorative 3D, excessive grids, and ornamental flourishes slow perception and can obscure the severity signal. Clear labels, restrained color, and direct encoding of status let inspectors act in a glance—the visualization principle that matches safety-critical municipal operations.
Adding heavy chartjunk and decorative 3D effects optimizes for “exciting slides” at the expense of accuracy and speed, which is the wrong objective for severity. Hiding severity labels to force memorization of color lore creates inaccessible, error-prone charts when color vision, printing, or new staff enter the workflow. Encoding severity only in tiny footnotes beneath unrelated stock photos buries the primary message and fails operational readability.
Exam caveat: Tufte-style clarity—minimize non-data ink for critical status charts; do not equate decoration with communication quality. Operational check: prototype severity badges with explicit text plus color, test glance time with inspectors, remove 3D and clip art, verify WCAG-ish contrast, and ship the clean version in the EMS response dashboard.