
A permitting and inspections bureau must brief council on housing vacancy across neighborhoods. Which visualization type best fits that geographic municipal indicator?
Select an answer to reveal the explanation.
Short Explanation
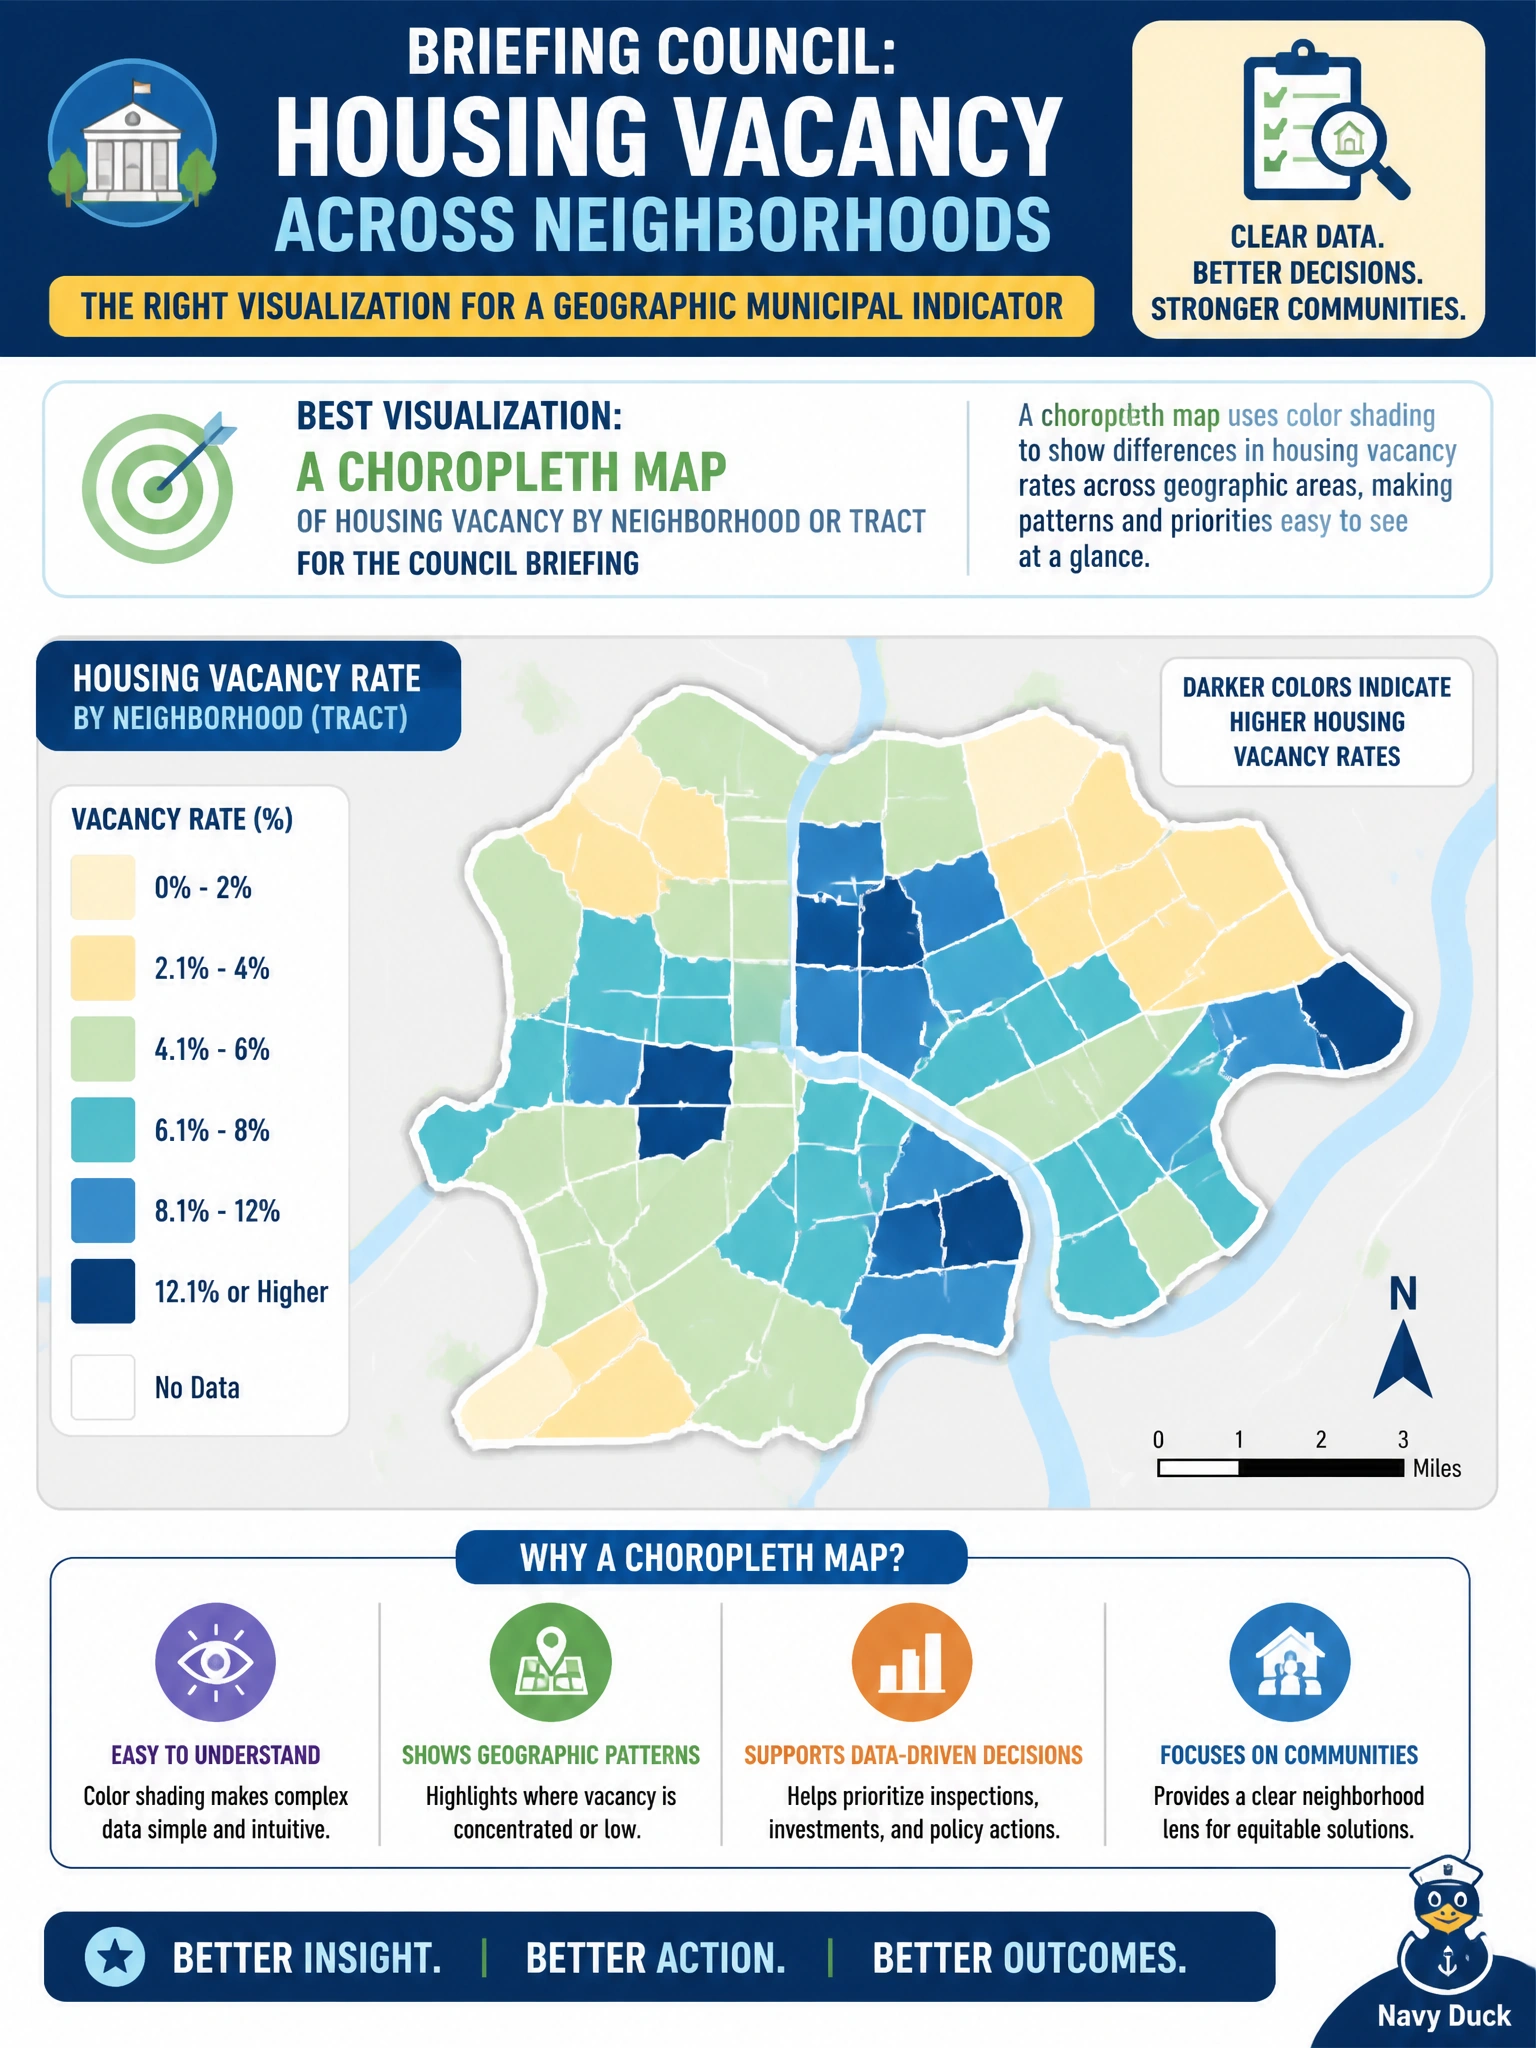
Council asking where vacancy clusters wants a map, not a word cloud of street names. A choropleth paints neighborhoods by vacancy so geography is obvious at a glance. Sparklines alone and exploding pies miss the spatial story permitting needs.
Full Explanation
Council briefings on where housing vacancy clusters geographically are best served by a choropleth map of vacancy by neighborhood or tract. Choropleths encode a rate or intensity on areal units so spatial concentration is immediately visible—critical for permitting and planning decisions that are inherently place-based. When the analytic question is “where do vacancies concentrate,” a statistical map aligned to vacancy rates beats non-spatial novelty charts and keeps the civic geography legible for non-analyst council members.
A single sparkline with no map context may show a citywide time trend but does not locate neighborhood clusters, so it fails the spatial brief even if the line is accurate. A 3D exploding pie of unrelated permit fee codes answers neither geography nor vacancy and adds perceptual distortion that planning reports should avoid. A word cloud of street names substitutes anecdotal text frequency for measured vacancy rates and is not a legitimate spatial distribution display for zoning or housing decisions.
Exam caveat: spatial rate comparison across areas → choropleth (or similar statistical map), not pies or word clouds for place questions. Operational check: join vacancy metrics to tract geometries with a documented denominator, choose a perceptually sound sequential color scale, include legend and data vintage, review small-N tracts, and present the choropleth with the same definition used in the planning memo so council can trust the map.