
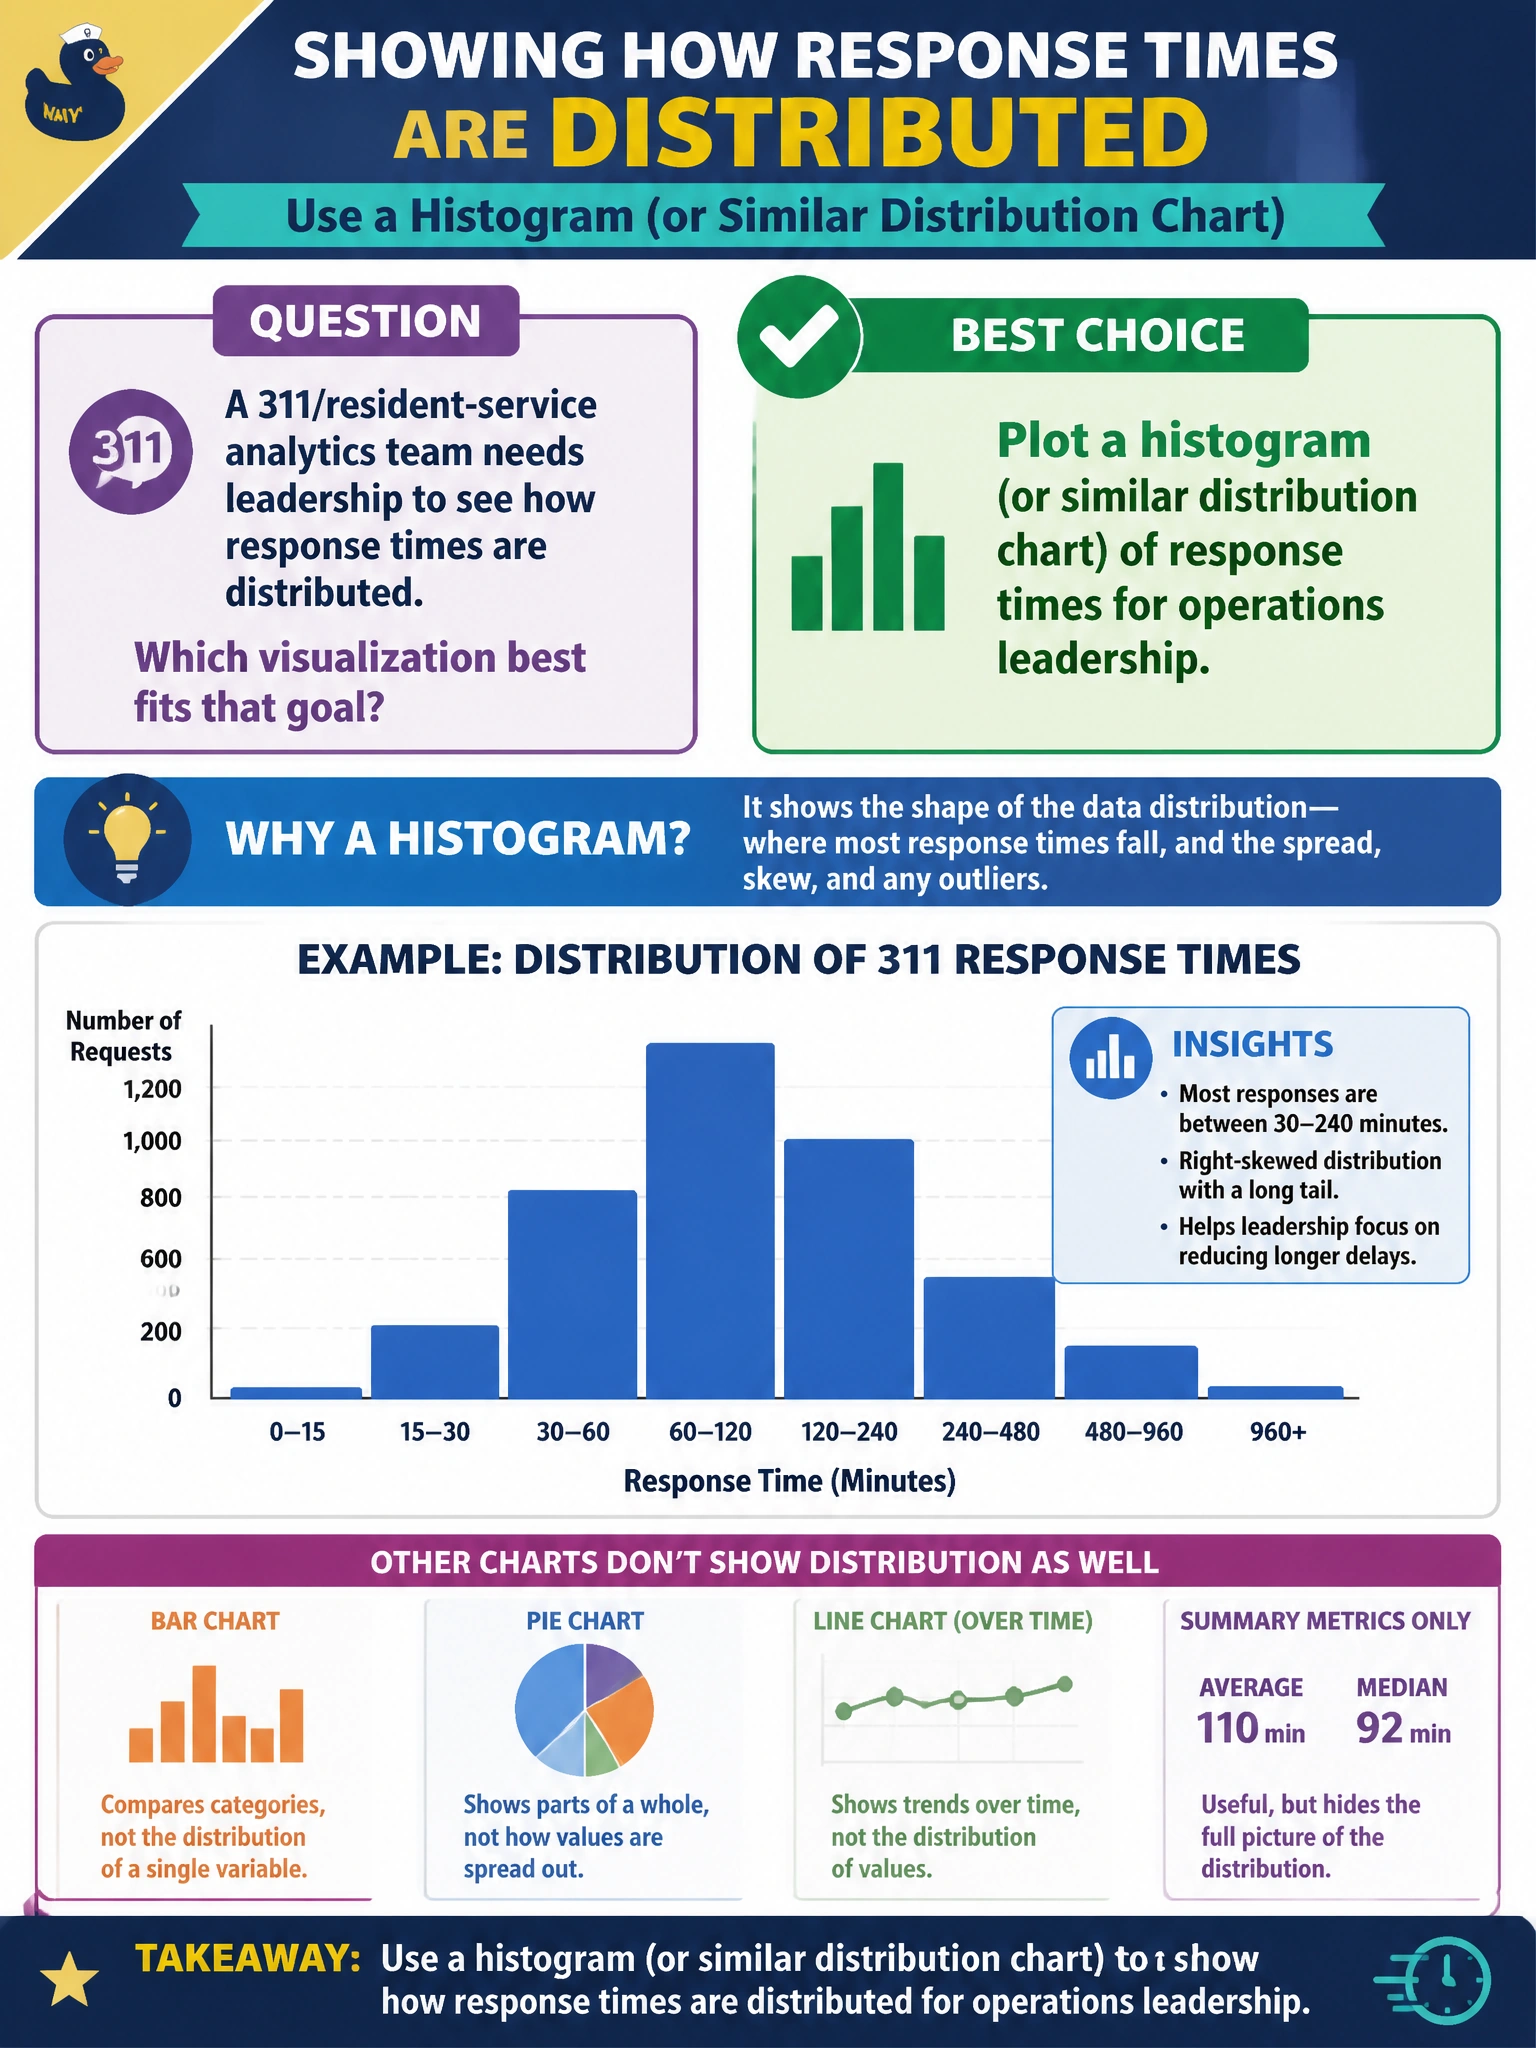
A 311/resident-service analytics team needs leadership to see how response times are distributed. Which visualization best fits that goal?
Select an answer to reveal the explanation.
Short Explanation
When you need leadership to see how 311 response times are spread out, a histogram makes the pattern easy to understand. A single citywide total hides that shape, and a pie chart of department names won’t tell you how long residents wait.
Full Explanation
When operations leadership needs to understand how 311 response times are distributed, a histogram or similar distribution chart is the right fit. It reveals the shape of the data—including the central mass, skew, multiple peaks, and heavy tails—so managers can see whether most tickets are resolved quickly while a smaller group experiences long waits that may threaten service-level agreements. Showing only a single citywide total collapses variation into one number and hides differences across neighborhoods, as well as equity and tail-risk concerns. A pie chart of department names and staffing levels is a mismatch: it shows categorical shares, not the continuous distribution of minutes residents wait, so it cannot answer the question. Encoding response times as unreadable raw hex strings in a table creates friction and gives leadership no perceptual summary of the distribution. Exam caveat: match the visualization to the analytic intent; for the distribution of a continuous civic metric, use a histogram or another distribution chart. Practical check: plot response-time histograms overall and by district, mark service-level agreement thresholds, compare the mean with the median, and include the chart in the weekly resident-service pack with a one-line interpretation of the tail.