
A county assessor parcel desk needs interactive views over a very large civic dataset for service-gap exploration. Which visualization approach best fits accelerated descriptive analysis?
Select an answer to reveal the explanation.
Short Explanation
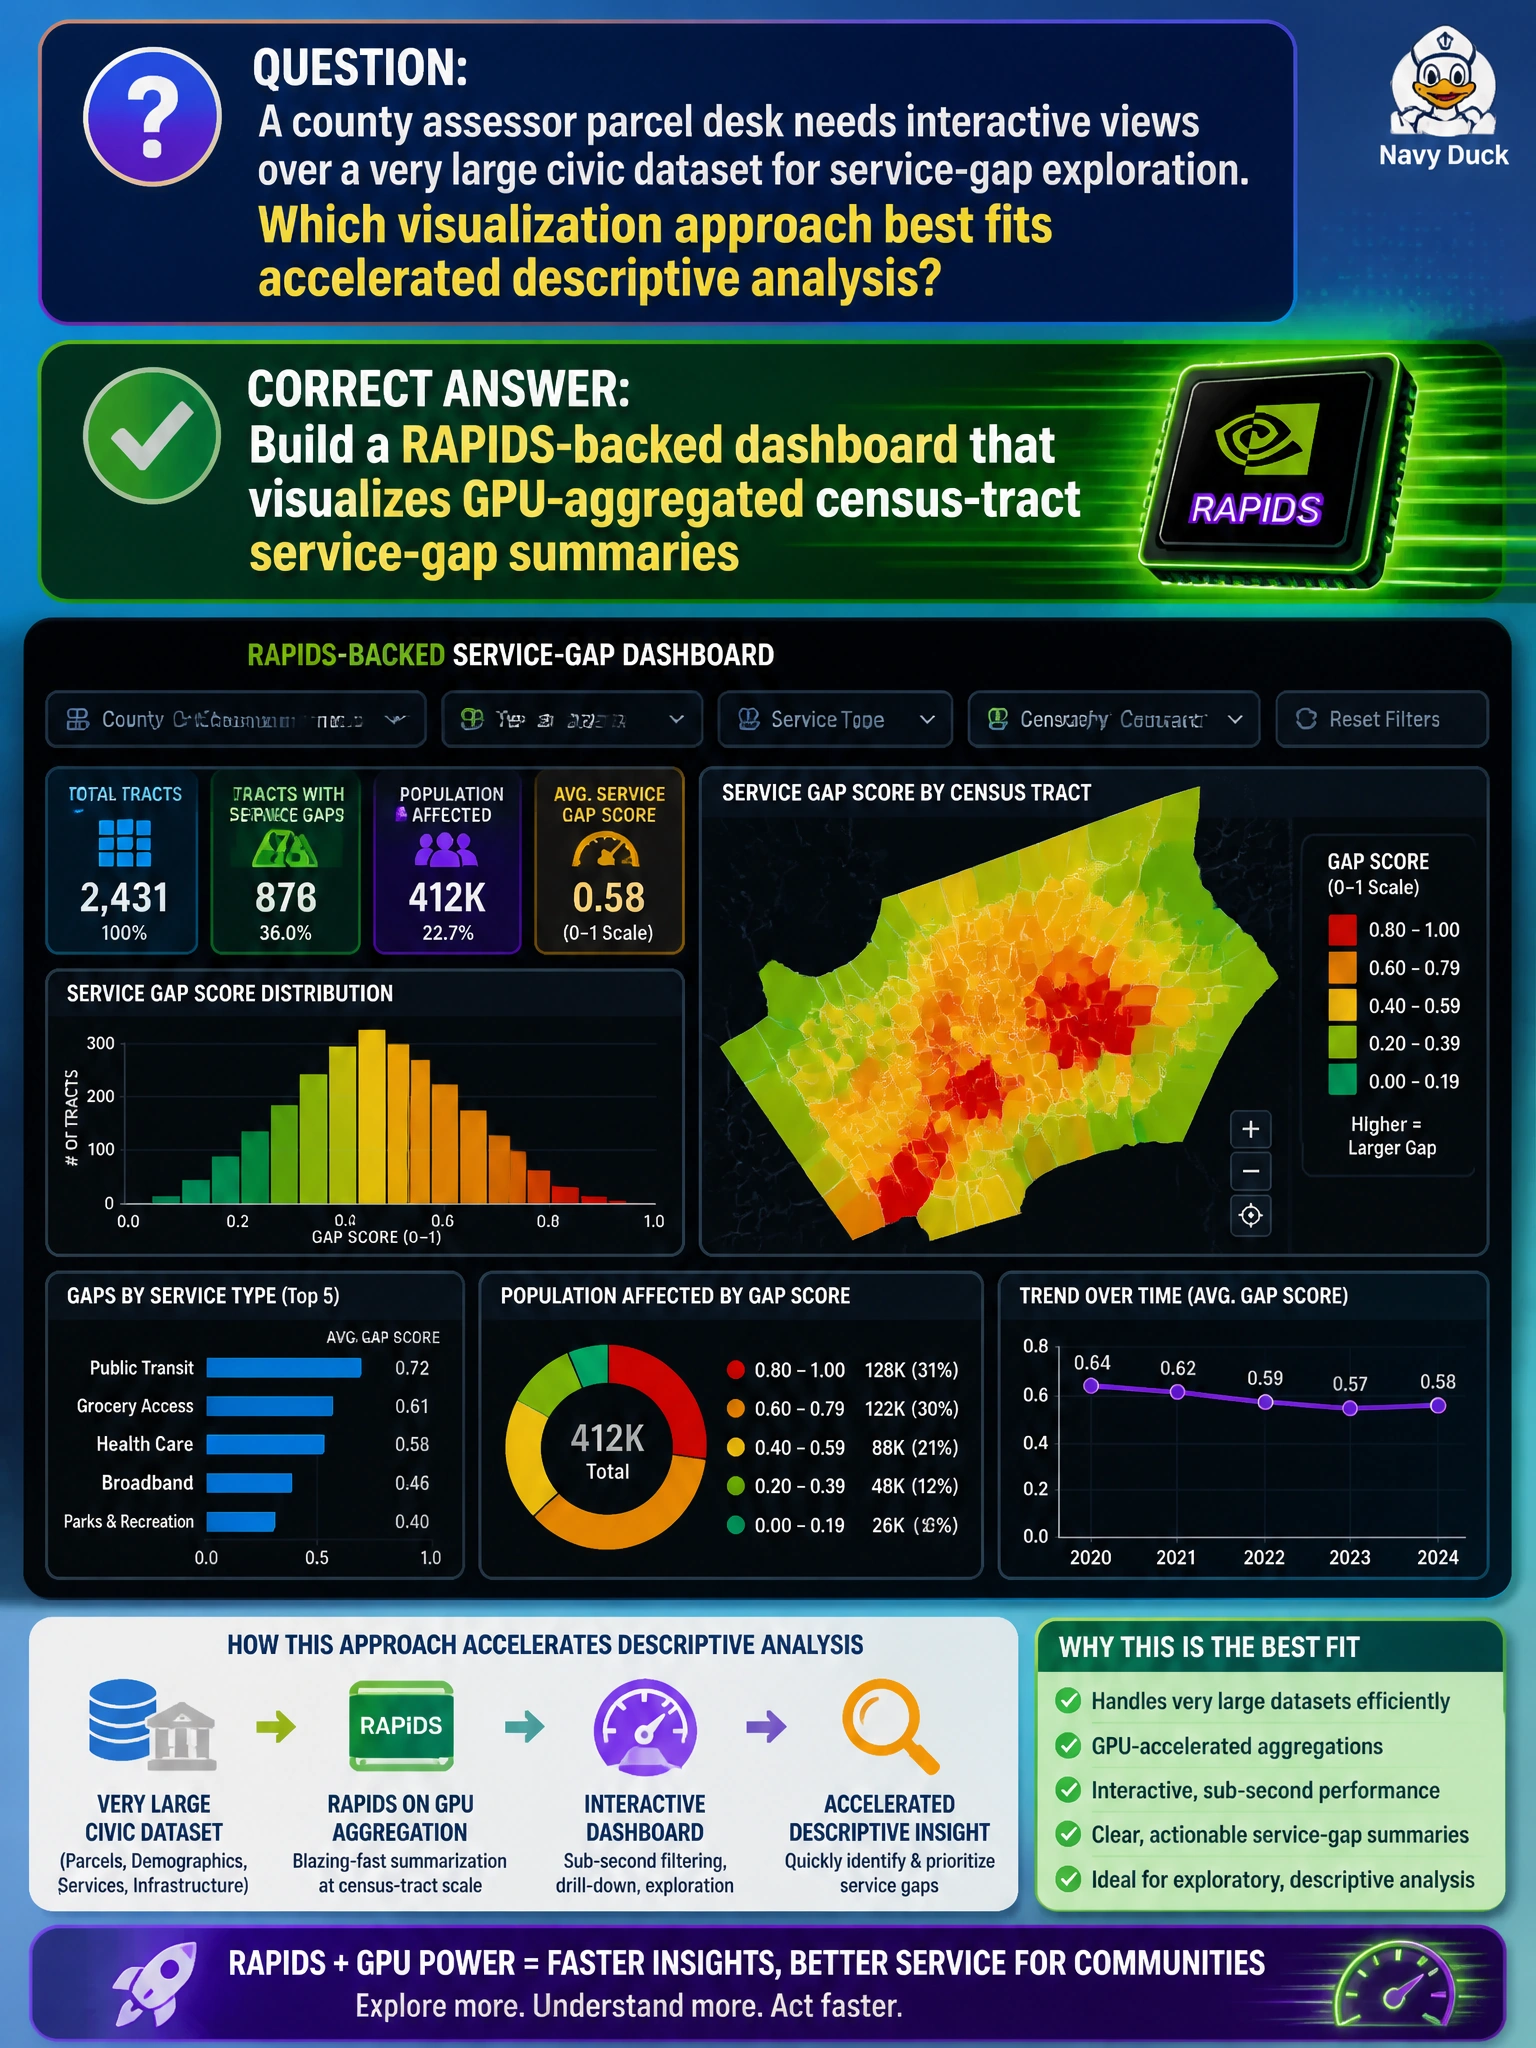
Huge parcel tables don’t belong as million-dot slide decks—aggregate on the GPU, then chart the summaries. A RAPIDS-backed dashboard lets the assessor desk see tract-level service gaps without melting the laptop. Raw row dumps are the opposite of accelerated visualization.
Full Explanation
Interactive exploration of a very large civic parcel dataset for service-gap analysis fits a RAPIDS-backed dashboard that visualizes GPU-aggregated census-tract summaries. Assessors cannot usefully scroll millions of raw parcel points; they need aggregates—counts, rates, gap scores—computed quickly and then charted at tract or neighborhood grain. GPU aggregation accelerates those group-bys so descriptive dashboards stay interactive, which is the point of accelerated descriptive analysis on municipal-scale tables.
Exporting millions of raw parcel rows into a slide deck and scrolling manually does not scale and is not analysis. Disabling GPU aggregates and redrawing every point on an underpowered laptop CPU only maximizes latency and memory pressure without improving insight. Avoiding visuals and emailing unsorted CSV dumps to council staff shifts the aggregation burden onto non-analysts and abandons accelerated visualization entirely.
Exam caveat: RAPIDS/GPU-accelerated workflows emphasize aggregate-then-visualize for large civic frames, not raw-row slideshows. Operational check: define tract-level service-gap metrics, run group-bys on GPU (RAPIDS), bind the summary table to the dashboard, verify row counts against the parcel warehouse, and refresh on a schedule the assessor desk can trust.