
A school-district enrollment analytics team is exploring tables before any model training. Which EDA use best treats analysis as a quality gate?
Select an answer to reveal the explanation.
Short Explanation
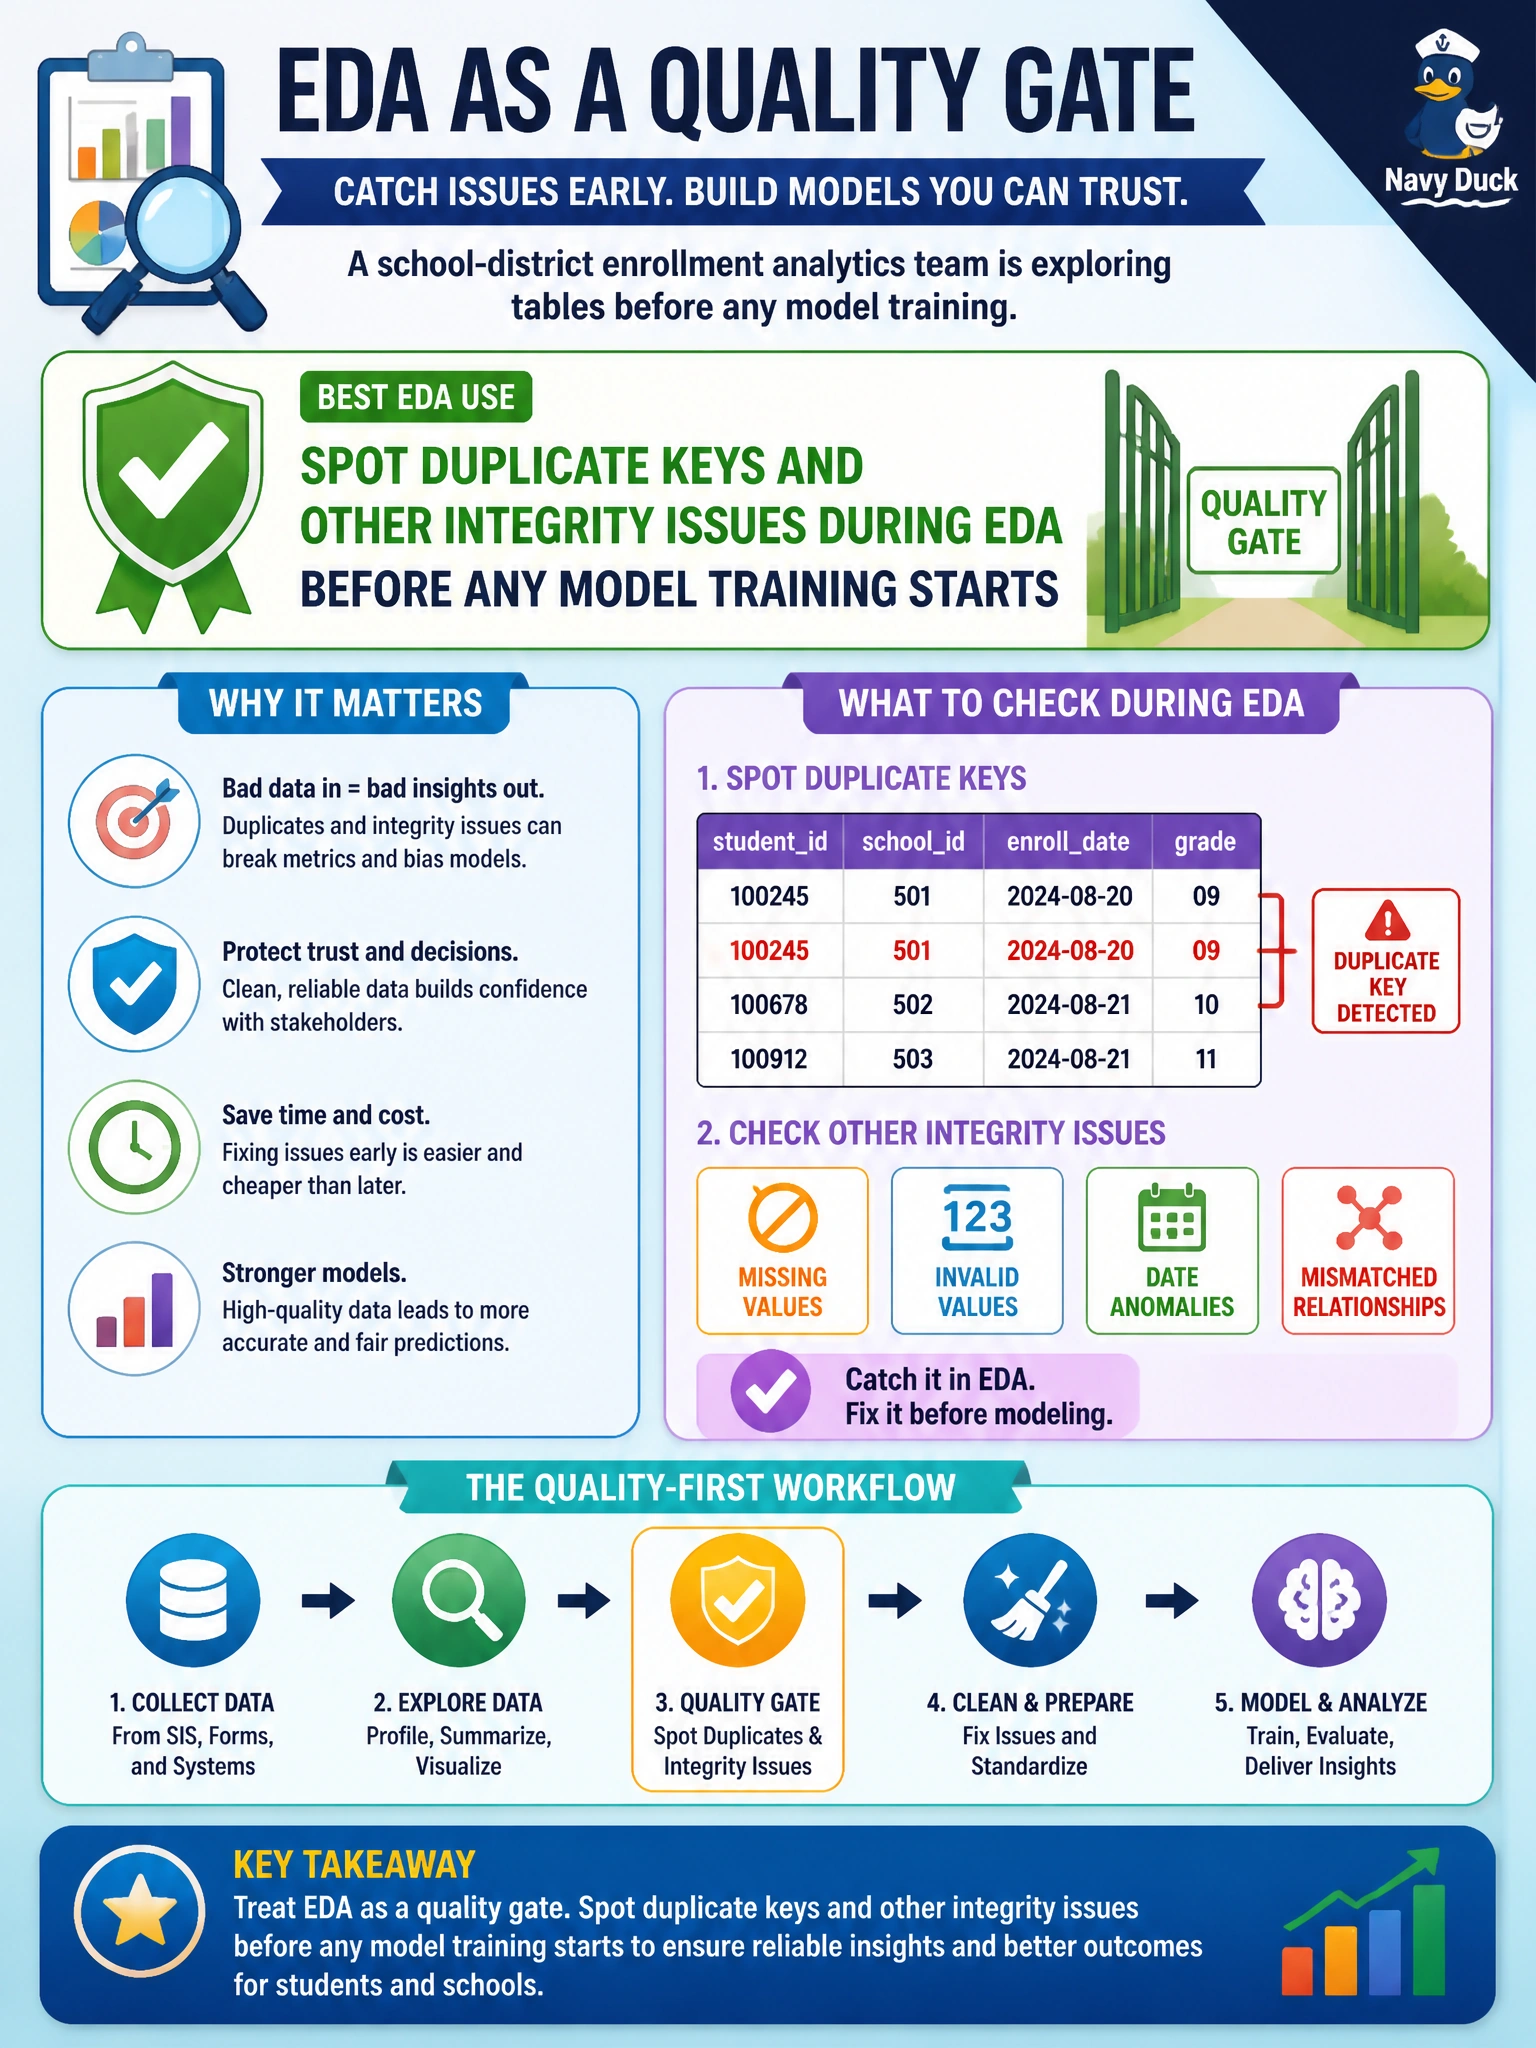
EDA isn’t just pretty charts—it’s the metal detector before the school-district modeling line. Catch duplicate keys and integrity issues first so training doesn’t bake in mess. Charts-only or train-first habits let bad rows walk right in.
Full Explanation
EDA as a quality gate for school-district enrollment analytics means spotting duplicate keys and other integrity issues before any model training starts. Duplicate student or enrollment keys, conflicting grade assignments, and broken foreign keys corrupt joins and leak identical rows into both train and test splits. Catching those defects during descriptive exploration—key uniqueness checks, referential audits, impossible date ranges—protects later models from baking institutional data mess into predictions about seats and services.
Only producing presentation charts and never inspecting keys or duplicates treats EDA as decoration rather than a gate, so pretty slides can still sit on corrupt grain. Starting training immediately and letting the model “reveal” data-quality issues later is backwards: models may fit duplicates confidently while metrics lie. Hiding duplicate enrollment rows from stakeholders so dashboards look cleaner is an integrity failure and governance risk; it conceals the problem instead of fixing source systems.
Exam caveat: descriptive analysis includes integrity checks (duplicates, keys) as a prerequisite to modeling—not chart-only theater and not train-first. Operational check: assert uniqueness on the enrollment primary key, count duplicate rates by school, reconcile conflicts with the SIS owners, document exclusions, and block the training job until duplicate-key rate is under the district’s agreed threshold.