
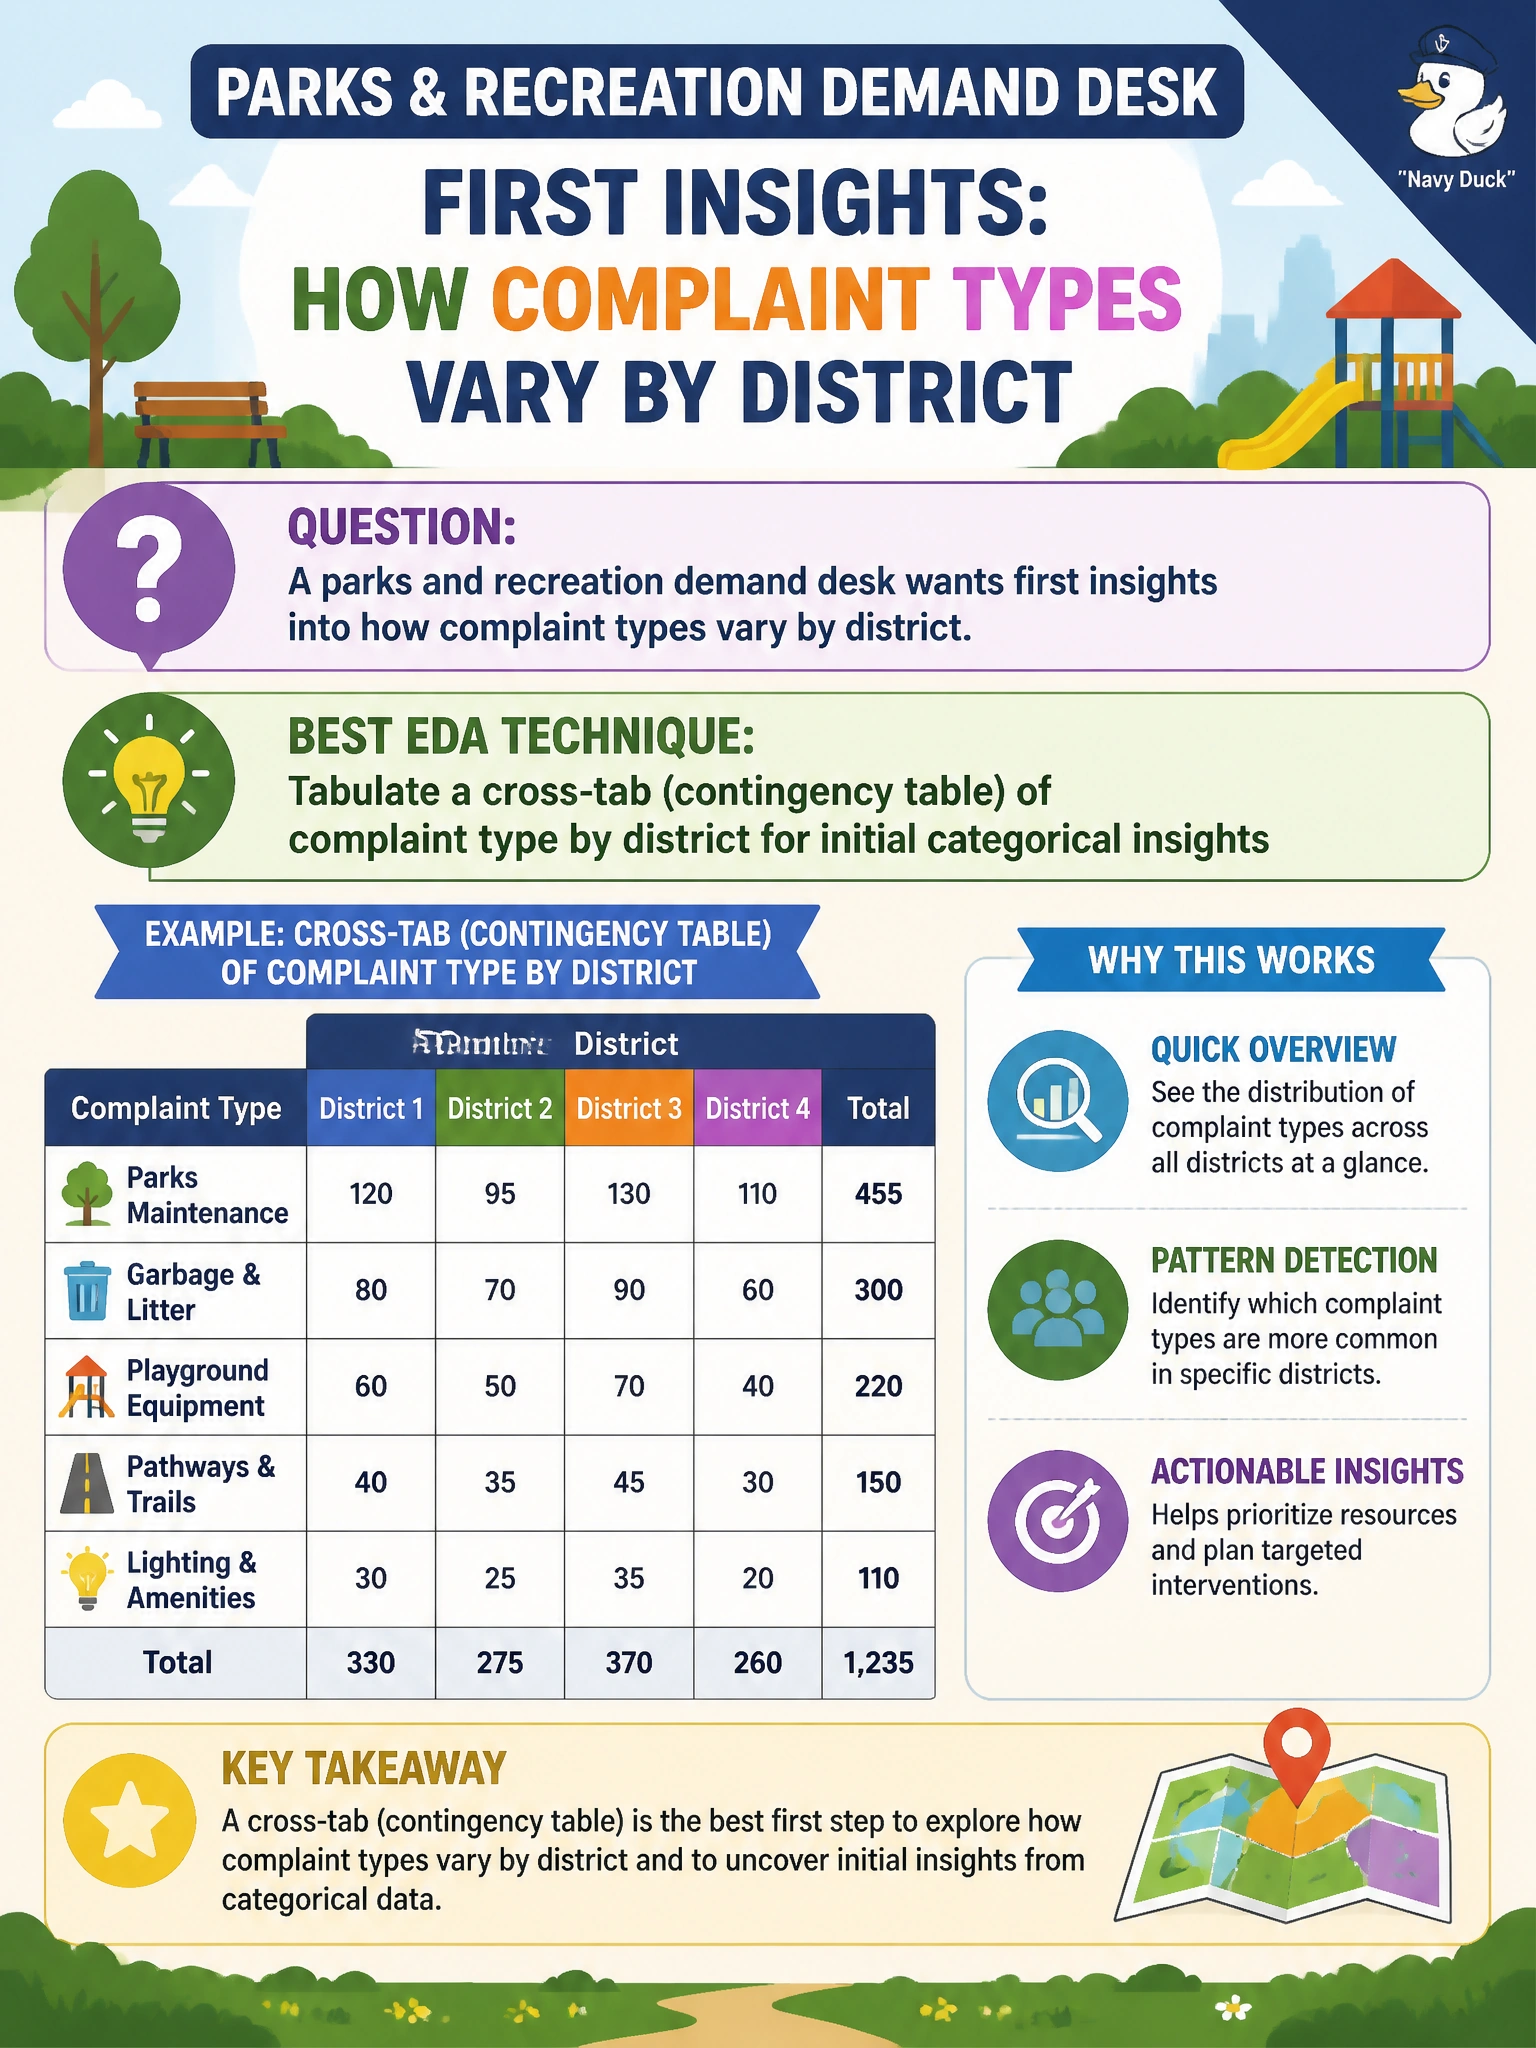
A parks and recreation demand desk wants first insights into how complaint types vary by district. Which EDA technique fits best?
Select an answer to reveal the explanation.
Short Explanation
Want a first look at which complaint types hit which parks districts? A cross-tab is the classic EDA cheat sheet—rows, columns, counts. Skip the neural net until the contingency table has told its story.
Full Explanation
First insights into how parks-and-recreation complaint types vary by district come from a cross-tabulation (contingency table) of complaint type by district. That classic EDA table shows joint frequencies: which districts generate graffiti versus maintenance versus safety complaints, and where counts concentrate. Categorical-by-categorical exploration belongs in descriptive tables before any heavy modeling. The cross-tab answers the desk’s immediate question with counts leadership can audit.
Fitting a deep neural net before any descriptive tables are built skips the understanding step EDA exists for and spends compute without knowing base rates or data quality. Converting every complaint type to a random embedding and skipping frequency tables replaces interpretable counts with opaque vectors that do not answer “which type where?” Averaging district IDs as if they were continuous measurements of complaint mix commits a scale abuse: district identifiers are categorical labels, not numeric magnitudes whose mean describes mix.
Exam caveat: initial categorical association insights → contingency/cross-tab, not DNN-first or ID-averaging. Operational check: build complaint-type × district counts (and row/column percentages), highlight sparse cells, export the table for the parks demand desk, and only later consider models once categories and geography are understood.