
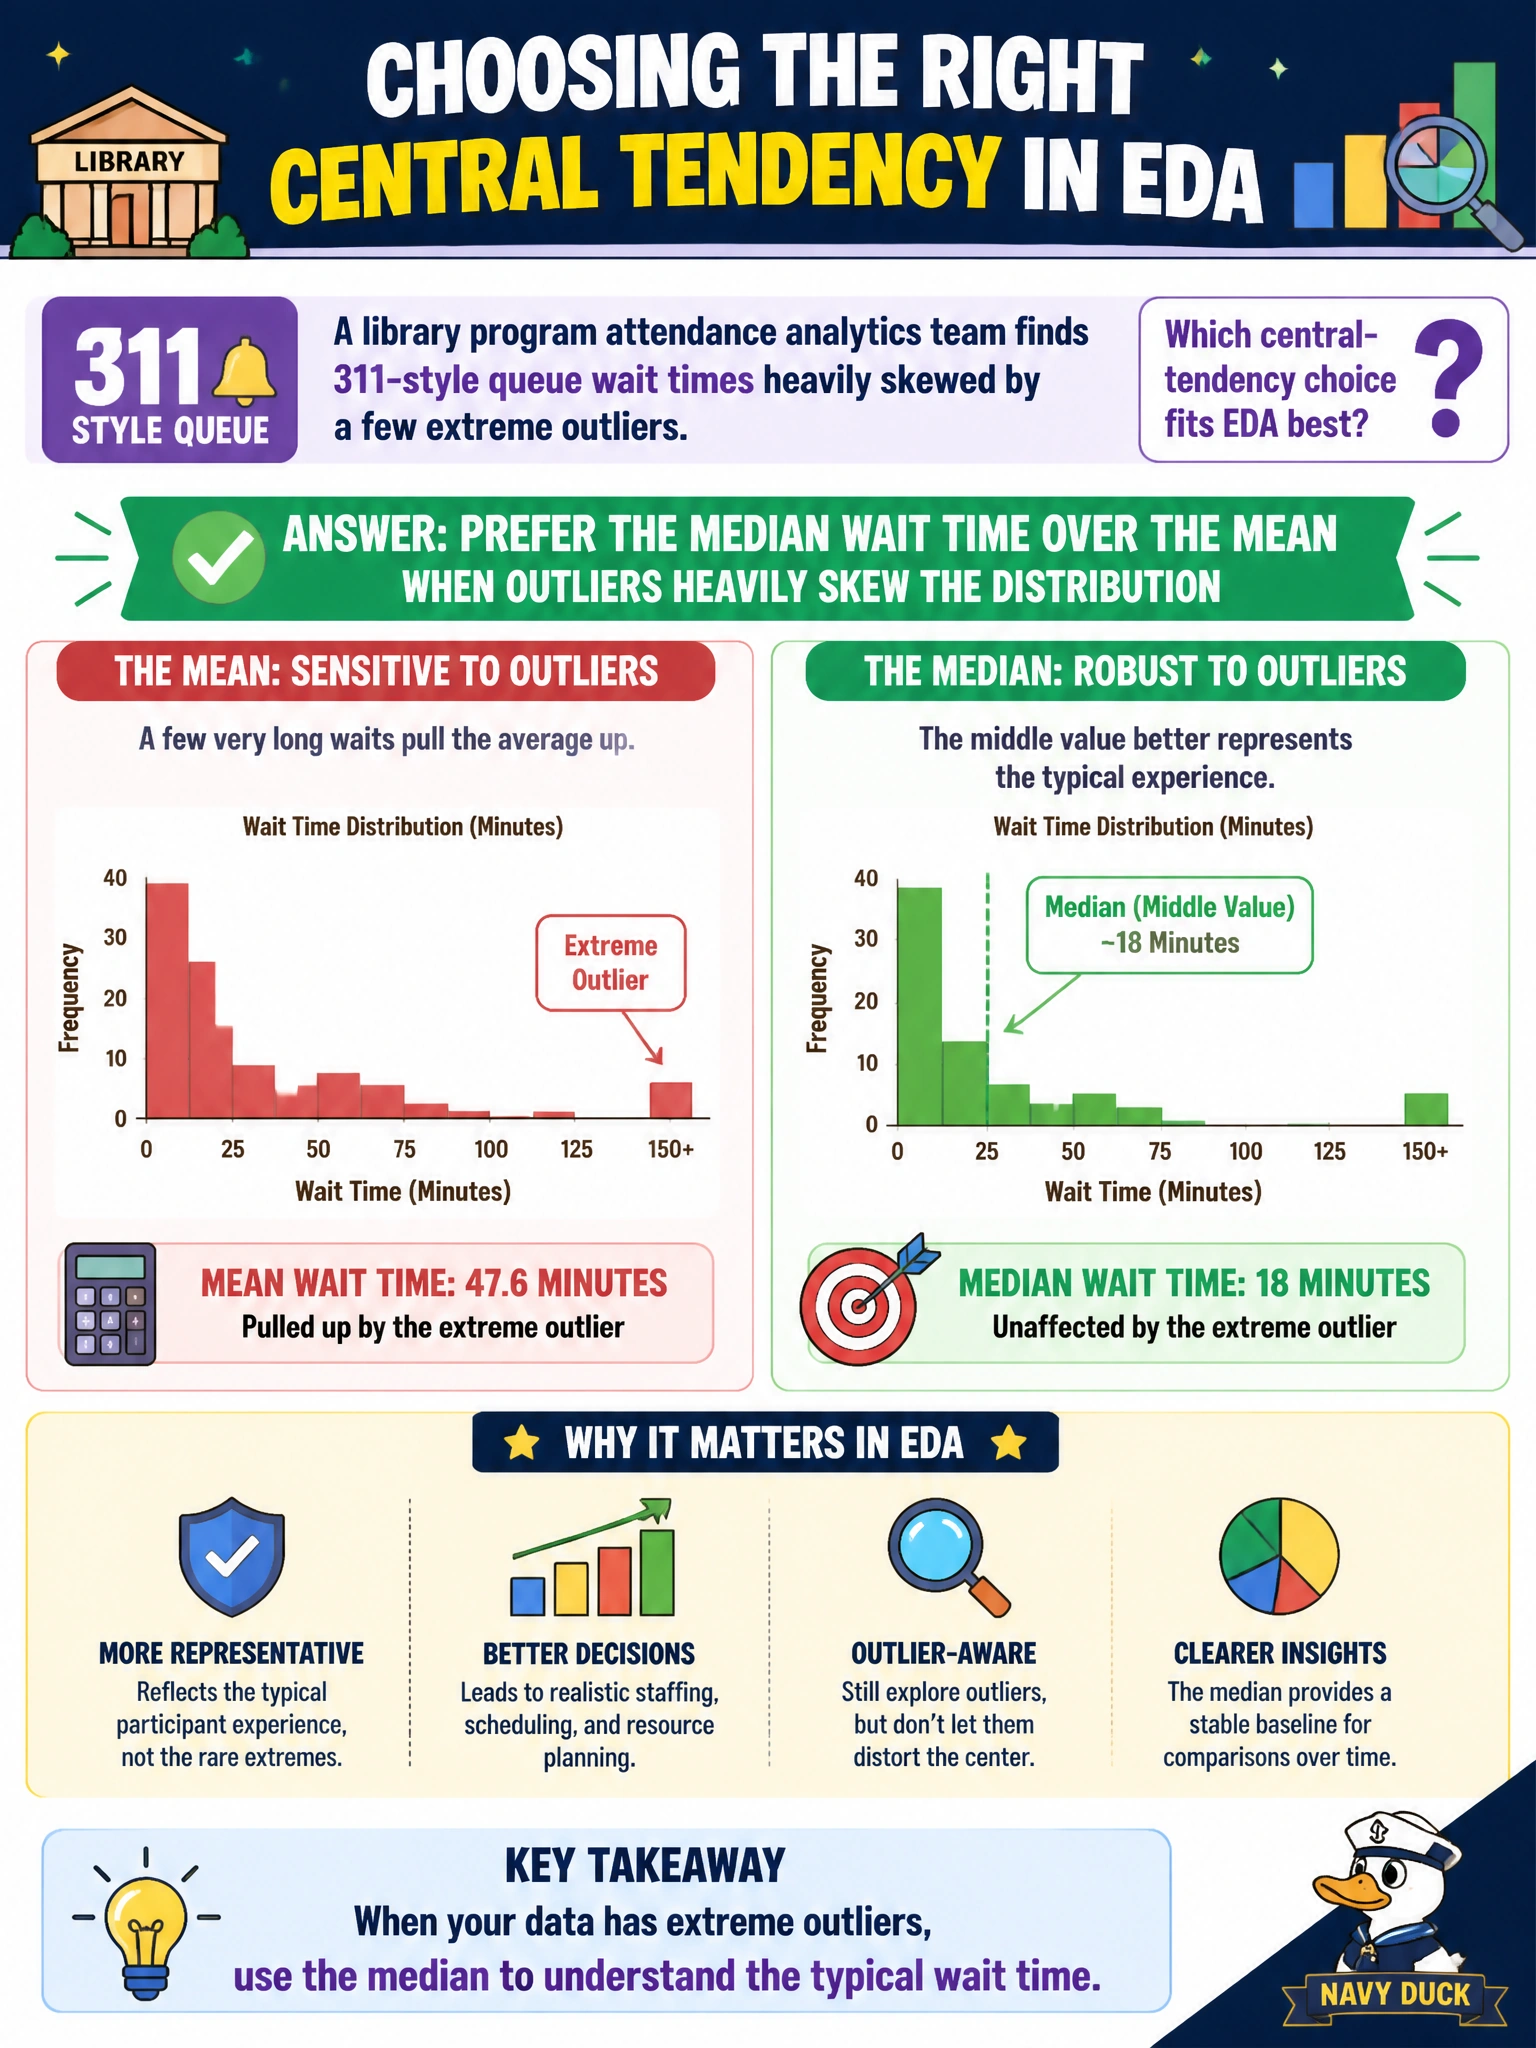
A library program attendance analytics team finds 311-style queue wait times heavily skewed by a few extreme outliers. Which central-tendency choice fits EDA best?
Select an answer to reveal the explanation.
Short Explanation
A handful of all-day queue nightmares can yank the average wait through the roof. For skewed civic waits, the median is the calmer “typical” story in EDA. Blind faith in the mean is how leadership gets the wrong picture of library and 311 queues.
Full Explanation
For heavily skewed 311-style queue wait times in library program attendance analytics, the median is the preferred central-tendency summary in EDA. A few extreme waits—system outages, abandoned tickets left open for days—inflate the mean so that “average wait” no longer describes the typical patron experience. The median resists those outliers and communicates the middle of the observed waits, which is what operations leadership usually means by “typical.” Preferring median over mean under heavy skew is a core descriptive-analysis habit.
Always reporting only the mean because it is “unaffected by extreme waits” is factually inverted: the mean is highly affected by extremes, which is why it misleads under skew. Using the mode of wait times as the only summary for continuous minutes is usually weak—continuous or finely binned minutes rarely have a meaningful unique mode, and mode ignores spread. Discarding central tendency entirely and showing no summary statistic leaves decision makers without a compact location measure they can track week to week.
Exam caveat: choose median (often with IQR) for skewed continuous civic waits; do not claim the mean is robust to outliers. Operational check: compare mean versus median wait for the library/311 queue, flag if mean ≫ median, report median with IQR or percentiles to leadership, and investigate the outlier tail separately rather than letting it redefine “typical.”