
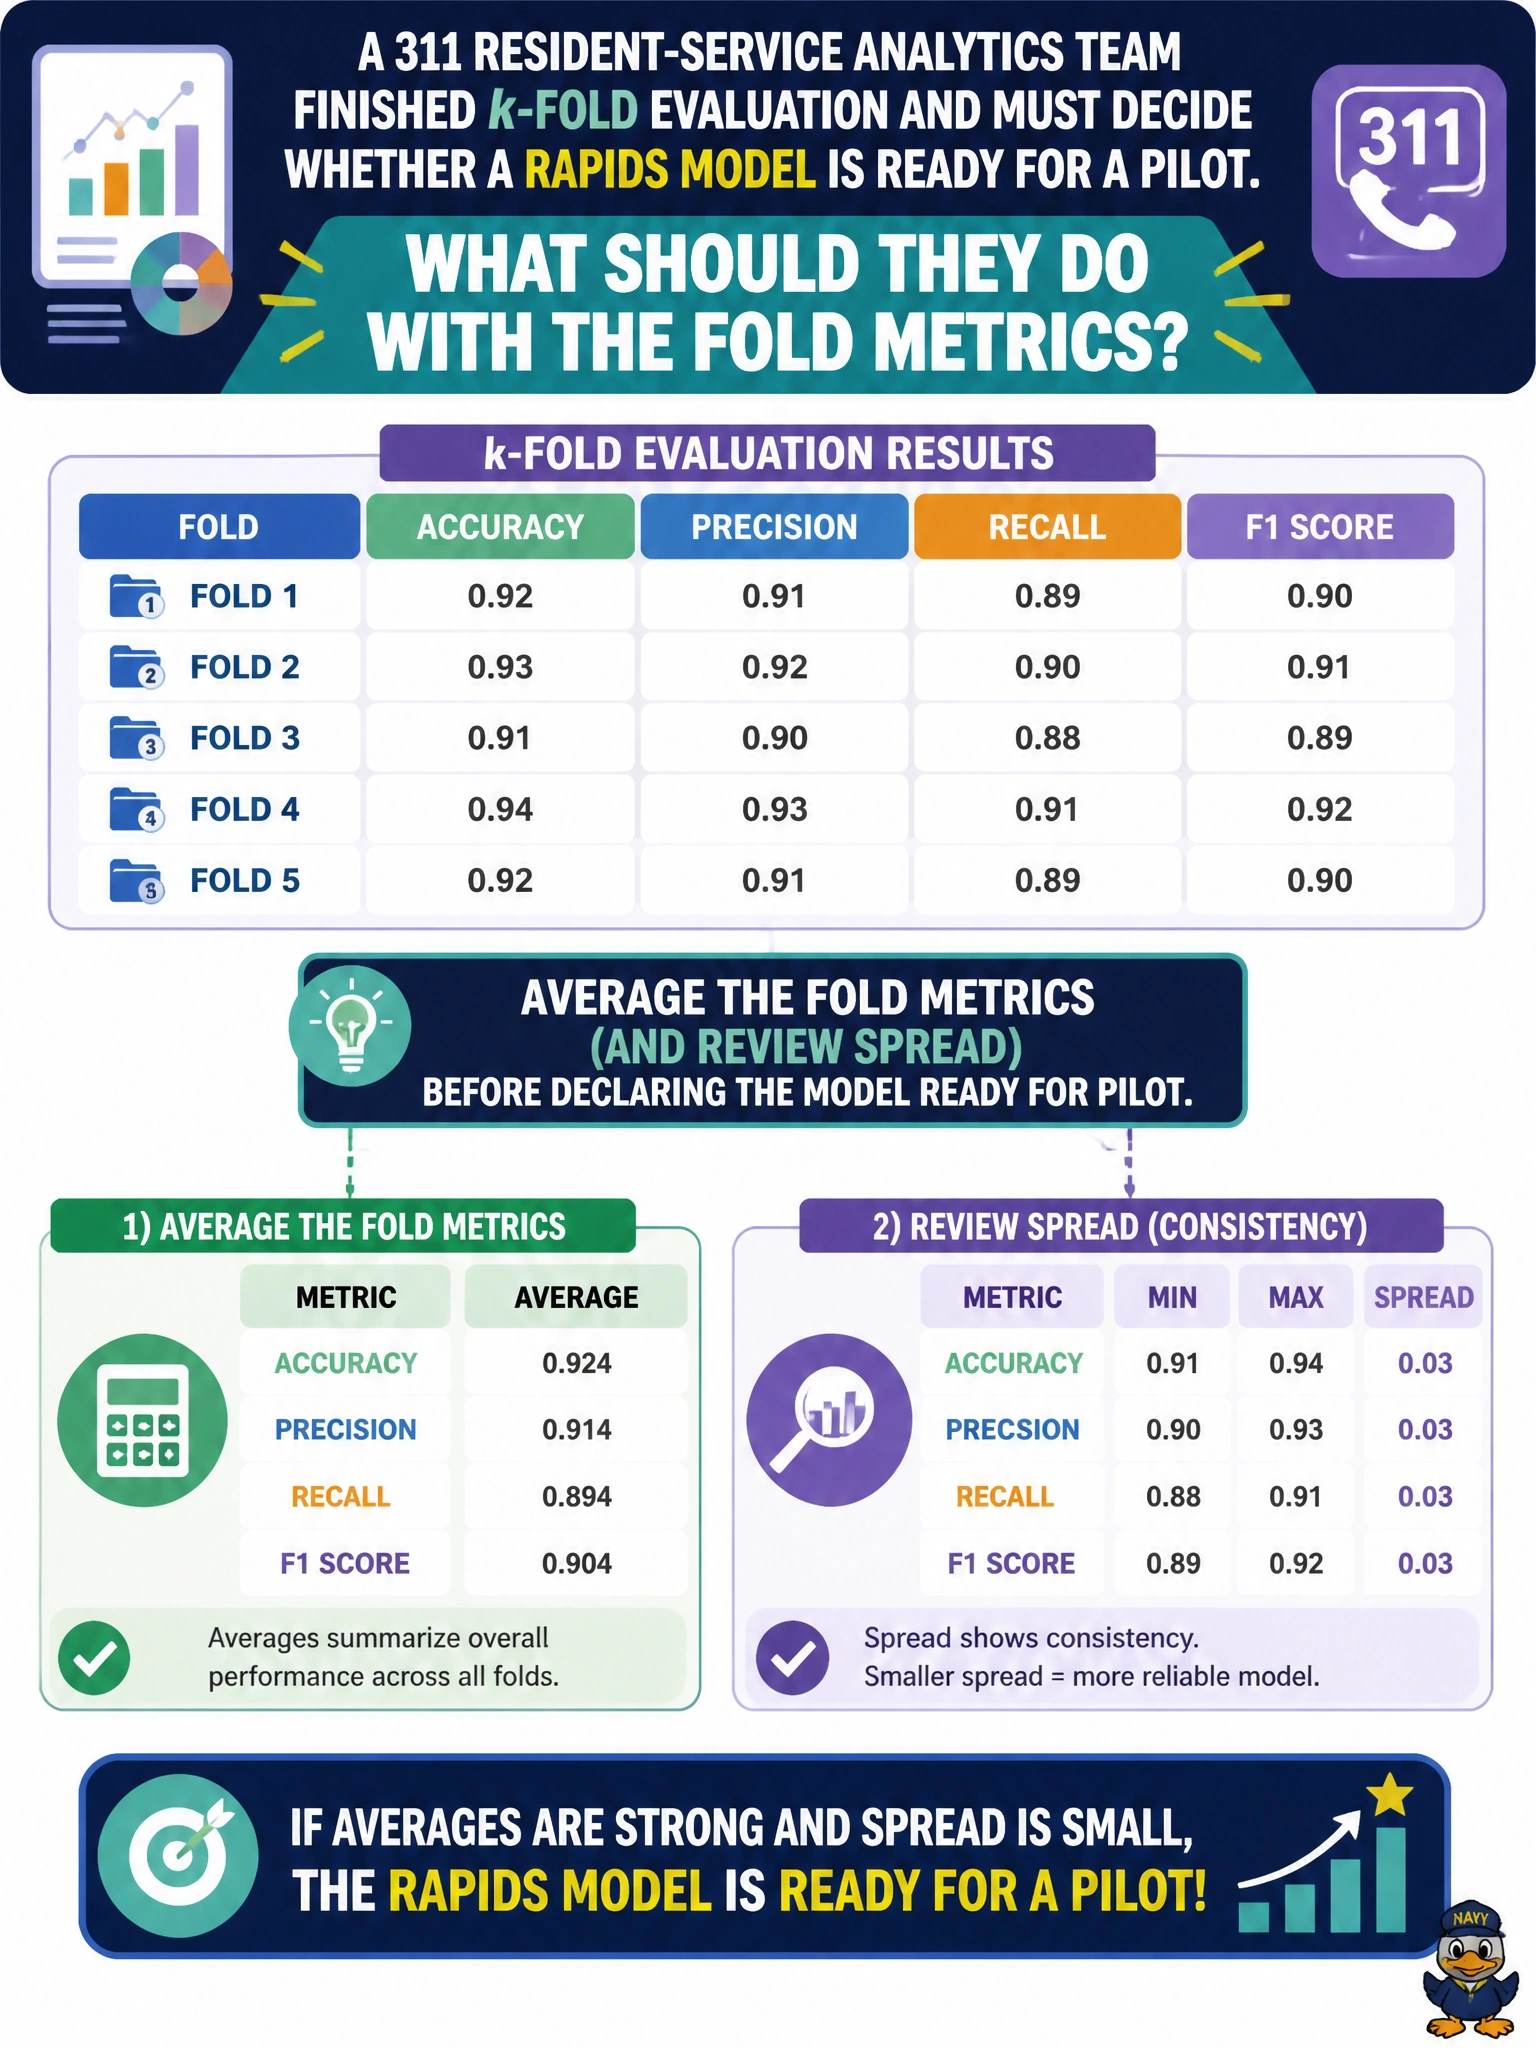
A 311 resident-service analytics team finished k-fold evaluation and must decide whether a RAPIDS model is ready for a pilot. What should they do with the fold metrics?
Select an answer to reveal the explanation.
Short Explanation
One lucky fold isn’t a citywide green light—average the fold scores (and peek at the spread) before the 311 pilot goes live.
Full Explanation
A 311 resident-service analytics team that finished k-fold evaluation should average the fold metrics and review spread before declaring a RAPIDS model ready for pilot. The mean summarizes typical performance across partitions; the spread reveals whether one lucky fold is masking brittle ticket types or districts. Piloting on a single rosy fold while ignoring weak folds risks a public-facing 311 failure when the live mix looks like the hard fold rather than the best fold.
Publishing only the single best fold and hiding the rest fails by concept—it is selective reporting that overstates readiness and misleads service owners. Ignoring folds that scored poorly without documenting why discards diagnostic signal about brittle segments and prevents targeted data fixes. Launching the pilot using training loss alone with no CV summary skips generalization evidence entirely and cannot justify a resident-facing rollout.
Exam caveat: a good average with huge fold variance is not automatic pilot-ready—investigate geographic or ticket-type concentration in weak folds before go-live, and confirm the metric matches the triage KPI operations will watch. Operational check: compute mean and standard deviation (or range) of fold metrics, set a maximum allowed spread with 311 service owners, document any exceptional fold with rationale, and gate the pilot on both central tendency and stability—not on the best fold alone.