
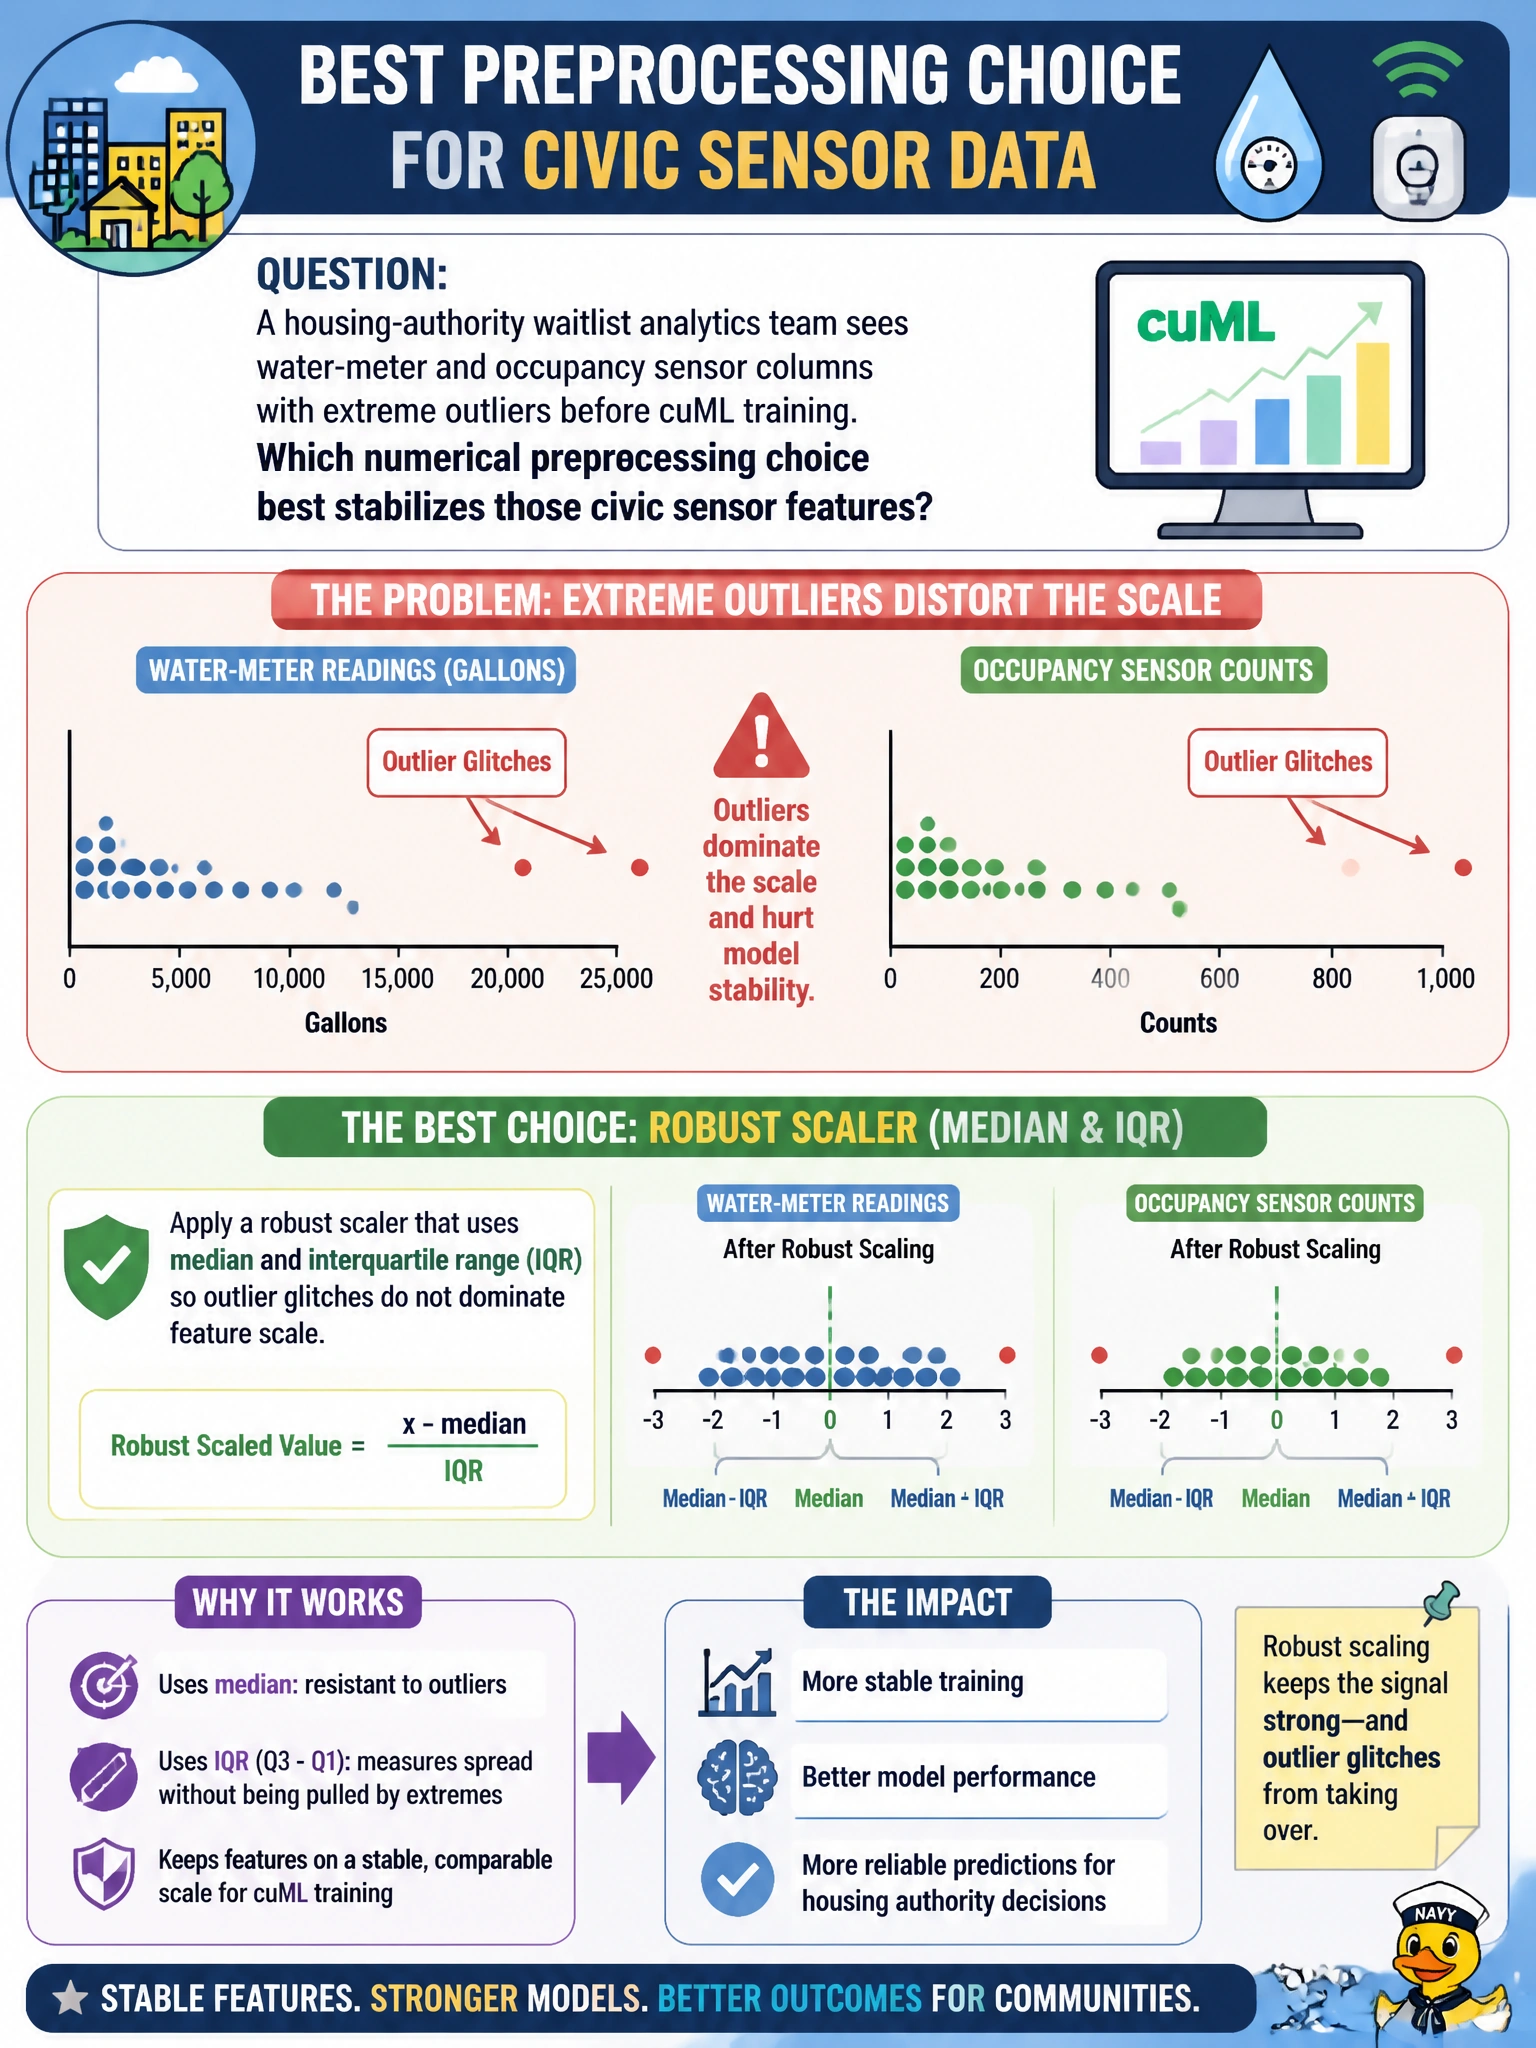
A housing-authority waitlist analytics team sees water-meter and occupancy sensor columns with extreme outliers before cuML training. Which numerical preprocessing choice best stabilizes those civic sensor features?
Select an answer to reveal the explanation.
Short Explanation
Sensor glitches are like a few wild potholes on an otherwise smooth street: they can throw off scaling based on the mean and standard deviation. A robust scaler uses the median and interquartile range, so those spikes are less likely to stretch the feature scale before cuML trains.
Full Explanation
For a housing-authority waitlist team preparing water-meter and occupancy sensor columns for cuML, robust scaling is a good fit for extreme outliers. It centers and scales numerical features with the median and interquartile range rather than the mean and standard deviation, so device faults, stuck registers, and rare occupancy spikes do not stretch the entire feature magnitude. This can stabilize gradient- and distance-sensitive learners on municipal sensor tables where a few bad readings are routine, keeping most legitimate meter variation in a usable range for GPU training. Discarding every record beyond one standard deviation fails because it can treat legitimate heavy tails and rare but real occupancy events as noise, arbitrarily shrink the civic sample, and does not ensure the remaining values are well scaled. Leaving raw units unchanged and relying on tree depth fails because differences between meter and occupancy scales can still affect distance-based steps, regularization, and many RAPIDS preprocessing paths, even though some tree models are somewhat scale-robust. One-hot encoding every sensor column fails because it destroys continuous magnitude, losing how large a meter or occupancy reading was and potentially creating a much wider representation with arbitrary categories. Exam caveat: robust scaling limits outliers’ influence on feature scale; it does not remove faulty sensors from labels or guarantee that extreme values are invalid. Practical check: plot sensor distributions before and after scaling on a housing waitlist extract, confirm the transform uses medians and IQRs, check that known meter glitches no longer dominate column norms, and compare cuML baseline validation stability on the same features.