
Your deep learning model is running on a DGX A100 server, but your GPU utilization metrics are unexpectedly low. You suspect that the bottleneck is inside the CUDA kernels themselves, possibly due to poor memory alignment or sub-optimal thread block configurations. Which command-line profiling tool should you use to capture real-time, instruction-level counters, warp states, and memory access patterns of the executing kernels to diagnose this issue?
Select an answer to reveal the explanation.
Short Explanation and Infographic
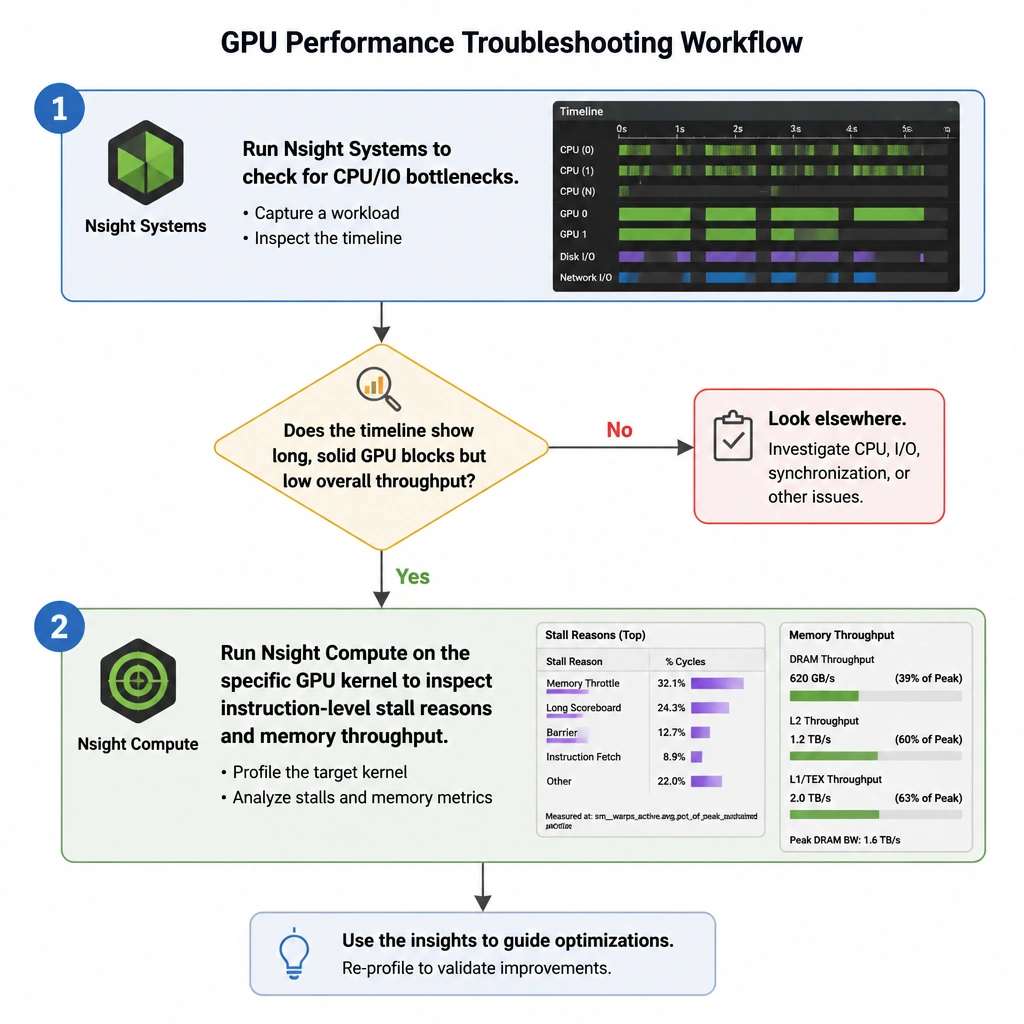
Check this out: when your GPUs are sitting there underutilized, it's easy to blame the network or disk speed. But what if the problem is inside the code itself? If your CUDA kernels are structured poorly—like having threads waiting on memory instead of doing work—your GPU utilization will plummet. To find out exactly what's happening at the hardware instruction level, you need Nsight Compute. It's the only tool here that can show you warp execution efficiency, register counts, and memory access patterns for specific kernels. Don't waste time with nvprof—it’s deprecated and won't help you on modern architectures like the A100. And while nvidia-smi shows you that utilization is low, it won't tell you why.
Full explanation below image
Full Explanation
Diagnosing low GPU utilization during deep learning workloads requires identifying whether the bottleneck lies at the system level (e.g., CPU data loading, I/O, or network communication) or the hardware level within the CUDA kernels themselves. If the system-level checks are clean, the bottleneck is likely caused by inefficient kernel execution. NVIDIA Nsight Compute (Option D) is the primary tool for detailed kernel-level debugging and optimization. It gathers hardware performance counters during execution to analyze warp states, memory throughput, and instruction-level parallelism. For example, if a kernel is memory-latency bound (where CUDA cores are stalled waiting for data from global memory), Nsight Compute will highlight this bottleneck and suggest solutions such as memory coalescing or using shared memory.
Let's compare this with the alternative options: - nvprof (Option A) is deprecated and does not support modern GPU architectures like the NVIDIA Ampere-based A100. - nvidia-smi (Option B) is a monitoring tool that displays global utilization percentages (e.g., 'GPU Utilization: 30%'), but it cannot inspect the execution of individual kernels or explain why cores are stalled. - NVIDIA Nsight Systems (Option C) is a system-wide tracer. It is the first tool you should run to visualize the overall timeline (to rule out CPU bottlenecks or communication delays), but it does not provide the instruction-level or warp-level analysis inside the kernel that Nsight Compute does.