
During a heavy LLM training run on a multi-GPU DGX system, you suspect one of the GPUs is thermal throttling or pulling excessive power. Without access to a graphical dashboard or external monitoring agent, which native command-line tool can you run directly from the shell to inspect the real-time wattage, temperature, and memory utilization of each individual GPU?
Select an answer to reveal the explanation.
Short Explanation and Infographic
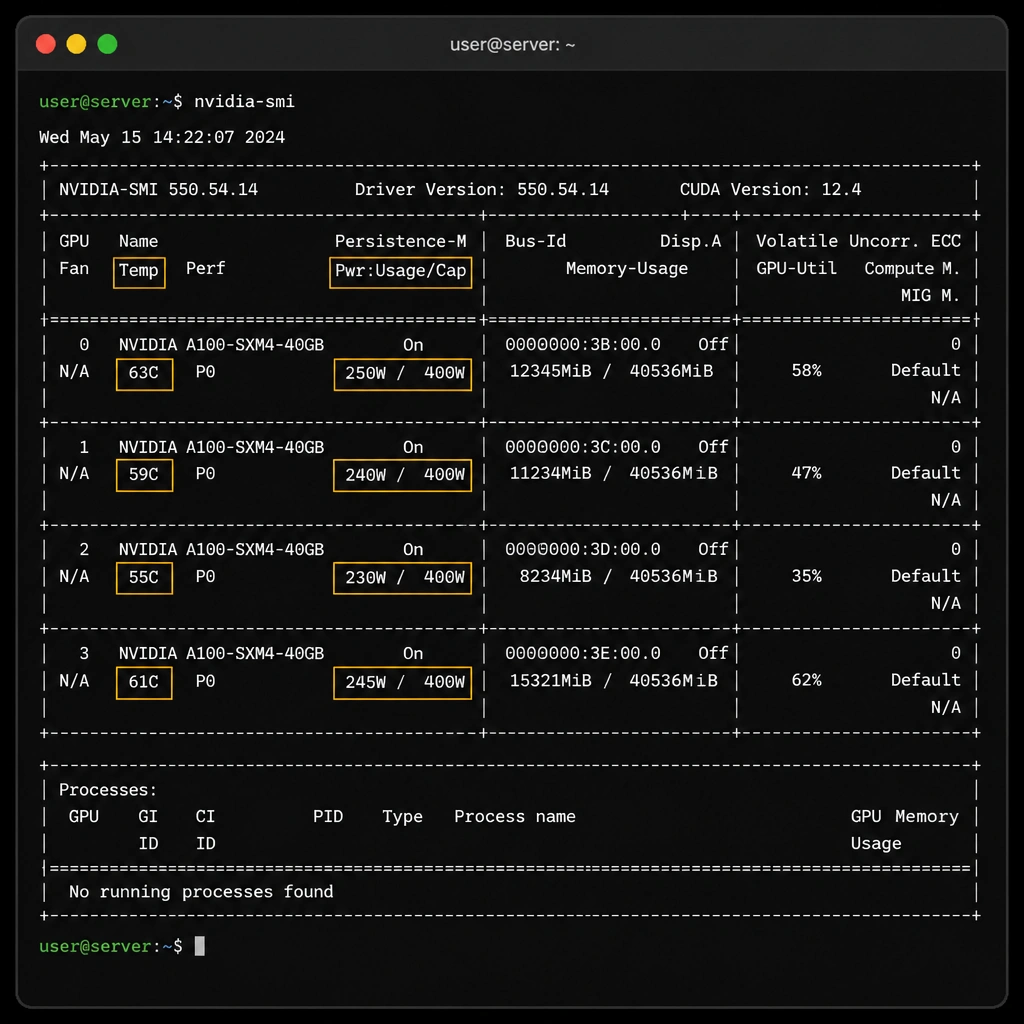
Here's the deal: if you are working with NVIDIA gear, nvidia-smi (System Management Interface) is your best friend. I use it daily. It's a built-in command-line tool that gives you a quick, live snapshot of what's happening on your GPUs. Run it, and it immediately spits out the power draw in watts, the temperature, how much VRAM is in use, and what processes are running on each card. It's fast, built-in, and doesn't require any fancy setup. Sure, top is great for checking your CPU and RAM, but it doesn't know anything about GPU power states. And nvprof is an old profiler, not a system monitor. Trust me, memorize nvidia-smi—you'll use it in the real world and you'll definitely see it on the test.
Full explanation below image
Full Explanation
The NVIDIA System Management Interface (nvidia-smi) is a command-line utility based on the NVIDIA Management Library (NVML). It is designed to aid in the management and monitoring of NVIDIA Tesla, GRID, Quadro, and GeForce devices, particularly in enterprise data center platforms like DGX systems. When troubleshooting power, thermal, or resource utilization issues on a host, nvidia-smi provides real-time telemetry directly from the command line. It displays current power draw (in Watts) alongside the maximum power limit for each GPU, current operating temperatures, fan speeds, ECC memory error counts, memory usage (VRAM), and GPU compute utilization. This allows administrators to quickly diagnose issues such as thermal throttling, power imbalances, or orphaned processes consuming GPU memory.
Let's examine why the other choices are incorrect: - nvprof (Option A) is a legacy command-line profiling tool for CUDA applications. It is used to measure code execution times and kernel performance, not to monitor hardware telemetry like power or temperature. - top (Option B) is a standard Linux utility that monitors CPU processes, system memory, and load averages. It has no native awareness of GPU hardware metrics or power draw. - gpustat (Option D) is a third-party Python script that wraps nvidia-smi to provide a simplified, colorized CLI view of GPU usage, but it is not a native utility pre-installed in the NVIDIA driver stack.