
An engineer is trying to optimize a custom CUDA kernel used in their deep learning model because it's running slower than expected on a DGX system. They need a tool that can inspect the GPU execution at the lowest level, measuring warp occupancy, memory access patterns, and instruction throughput of specific kernels. Which NVIDIA profiling utility should they use?
Select an answer to reveal the explanation.
Short Explanation and Infographic
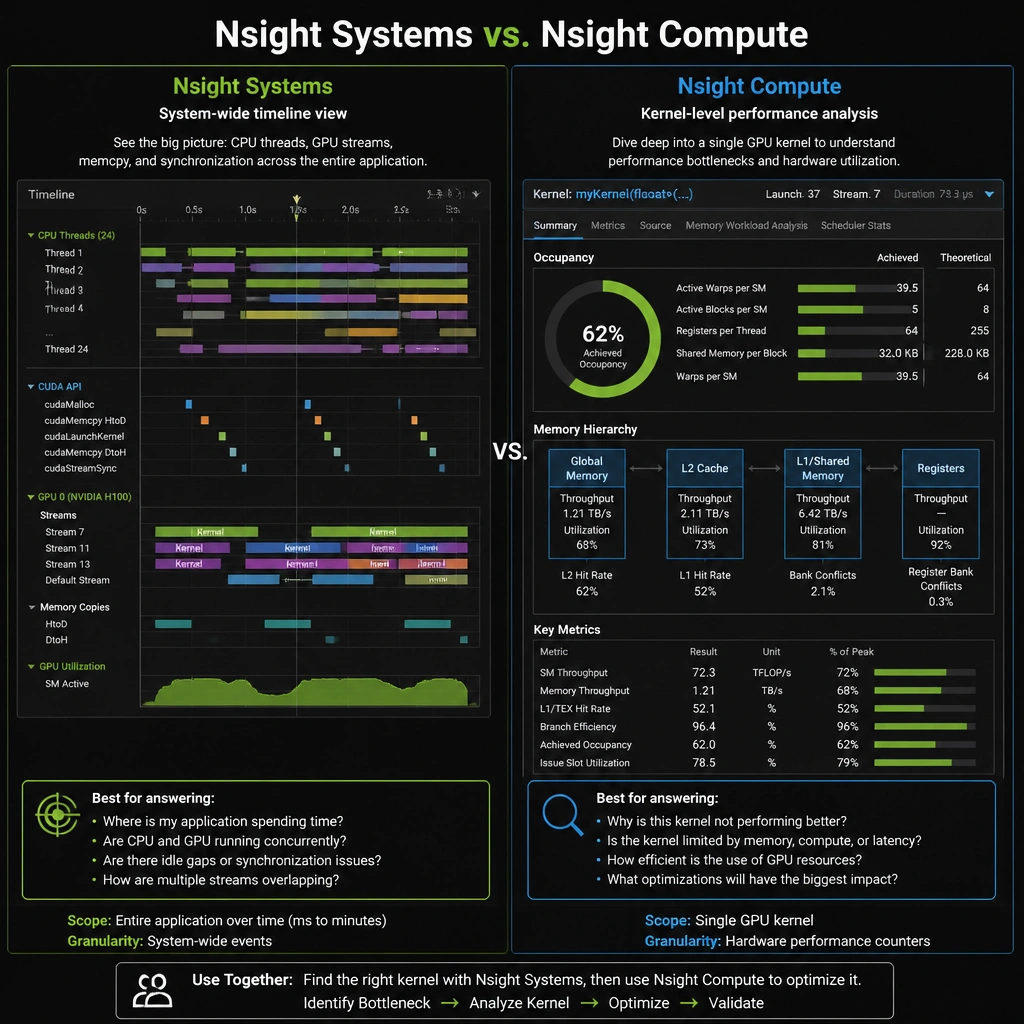
Pay close attention here, because this one bites people on the exam all the time. NVIDIA has two main profiling tools, and you must know the difference. Nsight Systems gives you the big, high-level picture—it shows CPU threads, GPU workloads, and network transfer timelines to help you find system-wide bottlenecks. But when you need to roll up your sleeves, look at a single CUDA kernel, and figure out why it's stalling (like checking memory latency or warp occupancy), you need Nsight Compute. Think of Nsight Systems as a traffic helicopter looking at the highway, and Nsight Compute as a mechanic under the hood looking at the engine cylinders. For kernel-level profiling, Nsight Compute is your tool.
Full explanation below image
Full Explanation
For deep profiling of CUDA applications on NVIDIA hardware, NVIDIA offers a suite of developer tools designed for different scopes of analysis. When the objective is to optimize a specific CUDA kernel at the instruction level, NVIDIA Nsight Compute is the correct utility (Option B). Nsight Compute is an interactive kernel profiler that provides detailed performance metrics for CUDA kernels. It allows developers to analyze hardware occupancy (the ratio of active warps to the maximum supported warps), memory bandwidth utilization, cache hit rates, register usage, and instruction throughput. It also features a built-in rules engine that suggests optimizations based on the gathered hardware counters, helping developers identify whether a kernel is compute-bound, memory-bound, or latency-bound.
Let's contrast this with the incorrect options: - NVIDIA Nsight Systems (Option A) is a system-wide profiling tool. It displays application activity across CPUs and GPUs on a unified timeline, which is excellent for finding execution gaps, API overhead, or communication bottlenecks, but it does not provide detailed internal metrics of individual CUDA kernels. - NVIDIA Virtual GPU (vGPU) (Option C) is a virtualization software technology that enables multiple virtual machines to share physical GPU resources; it is not a profiling tool. - NVIDIA System Management Interface (nvidia-smi) (Option D) is a command-line utility for monitoring GPU health, temperature, power, and memory usage. It operates at a high system level and cannot profile application code or kernel execution details.