
An administrator is investigating a potential out-of-memory error on an NVIDIA GPU node. Which built-in command-line tool provides direct, real-time statistics on GPU memory allocation, power consumption, and temperature?
Select an answer to reveal the explanation.
Short Explanation and Infographic
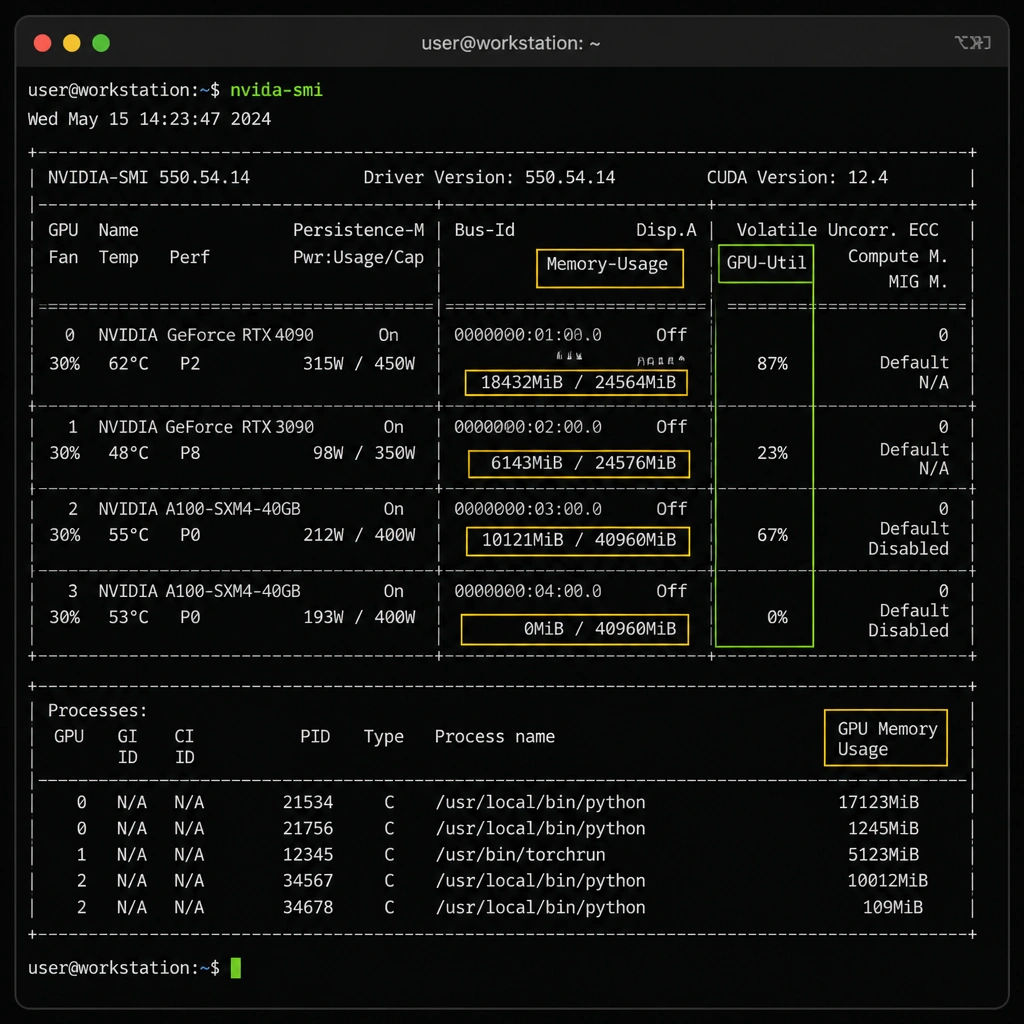
If you are working with NVIDIA hardware, nvidia-smi is going to be your absolute best friend. SMI stands for System Management Interface. When you run this command in the terminal, it gives you a clean, real-time snapshot of what's happening under the hood of your GPUs. It shows you exactly how much VRAM (GPU memory) is allocated, how much is free, GPU utilization percentages, power draw, and even temperature. It's built right into the NVIDIA driver package. Let's look at the other options so you don't get tripped up. The free command is a classic Linux tool, but it only shows host system RAM, not GPU VRAM. The top tool shows CPU and system process activity, not GPU cores. And nvcc? That's the CUDA compiler used to build GPU code, not a monitoring utility. Trust me, memorize nvidia-smi for the exam and real life—you'll use it daily.
Full explanation below image
Full Explanation
The NVIDIA System Management Interface (nvidia-smi) is a command-line utility based on the NVIDIA Management Library (NVML). It is designed to assist in the management and monitoring of NVIDIA Tesla, GRID, Quadro, and GeForce devices. It provides real-time monitoring of critical GPU metrics, including: - GPU Memory (VRAM): Displays total memory, currently allocated memory, and remaining free memory. This is critical for diagnosing Out-Of-Memory (OOM) errors during training. - Temperature and Cooling: Monitors thermal performance to detect thermal throttling. - Power Draw: Shows current power usage against the GPU's maximum power limits. - Core Utilization: Monitors GPU engine usage to verify that workloads are efficiently utilizing the hardware. - Active Processes: Lists the PID and memory consumption of processes currently running on each GPU.
Other options are incorrect for the following reasons: - free (Option C) is a standard Linux utility that displays the total amount of free and used physical host memory (RAM) and swap space, but it has no visibility into GPU memory. - top (Option A) is a system monitor utility that lists running host processes, CPU utilization, and system memory usage, but does not display GPU-specific metrics unless specialized plugins are installed. - nvcc (Option D) is the NVIDIA CUDA Compiler driver, used to compile CUDA C/C++ code into executable binaries, and does not provide runtime monitoring capabilities.