
An operations engineer is debugging a Kubernetes GPU monitoring stack. They can see GPU statistics locally on the nodes using command-line utilities, but the metrics are not showing up in the Grafana dashboards. The engineer realizes that while the low-level monitoring engines are active, the bridge that collects and formats these metrics for the Prometheus server is missing. Which component needs to be deployed to bridge this gap?
Select an answer to reveal the explanation.
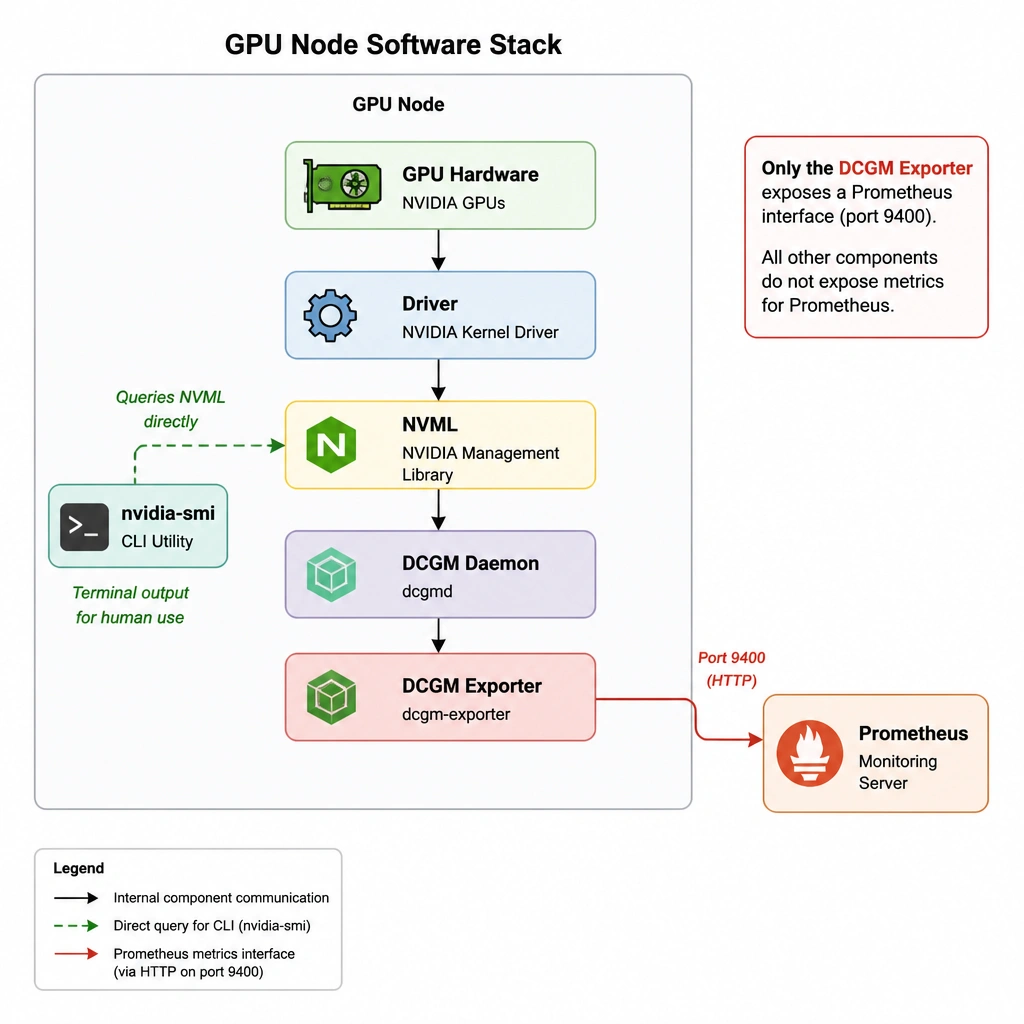
Short Explanation and Infographic
Here's the deal: monitoring GPUs is a multi-layered process. At the very bottom, you have the hardware. Right above that is NVML (NVIDIA Management Library), which is the low-level C-based API that talks directly to the driver. The command-line utility you probably use all the time, nvidia-smi, is just a tool that queries NVML to show you a quick snapshot on your terminal. In a data center, you also run the DCGM daemon to manage group operations and health checks. But none of these tools speak the Prometheus language out of the box! You need a wrapper that pulls the data from DCGM and formats it as HTTP-accessible metrics. That's the job of the DCGM Exporter. If you see stats in nvidia-smi but nothing in Grafana, the exporter is almost certainly what you forgot to install. Trust me on this!
Full explanation below image
Full Explanation
When monitoring NVIDIA GPUs in a Kubernetes cluster, it is easy to confuse the various layers of the monitoring stack. At the lowest level is the NVIDIA Management Library (NVML), a C-based API for monitoring and managing various states of NVIDIA GPU devices. NVML is direct and low-level, but it does not expose metrics over HTTP or in a format that modern cloud-native monitoring systems can consume. The NVIDIA System Management Interface (nvidia-smi) is a command-line utility built on top of NVML. It is intended for human operators to run interactive queries and view local GPU status, but it is not designed for continuous high-frequency scraping by automated systems. The NVIDIA Data Center GPU Manager (DCGM) is a suite of tools for managing and monitoring GPUs in cluster environments. It runs as a daemon (nv-hostengine) and collects telemetry data, performs diagnostics, and manages power and clocks. However, DCGM itself does not format this data for Prometheus. The NVIDIA DCGM Exporter is the specific agent that acts as a bridge. It queries the DCGM daemon, gathers the telemetry data, formats it into Prometheus-compliant metrics, and hosts a web endpoint (typically on port 9400) that the Prometheus server scrapes. Let's analyze the options: Option C is correct because the DCGM Exporter is the component that formats and exposes the metrics for Prometheus and Grafana integration. Option A is incorrect because nvidia-smi is an interactive command-line tool, not an automated exporter. Option B is incorrect because NVML is a low-level library, not a network-accessible exporter. Option D is incorrect because the DCGM daemon collects the data internally but does not format or expose it for Prometheus consumption.