
You are setting up a Prometheus-based observability stack for a Kubernetes cluster that runs large-scale GPU workloads. You need a tool that can gather GPU telemetry, such as temperature, memory usage, and Tensor Core utilization, and expose it in a text-based format that Prometheus can scrape. Which NVIDIA component should you deploy?
Select an answer to reveal the explanation.
Short Explanation and Infographic
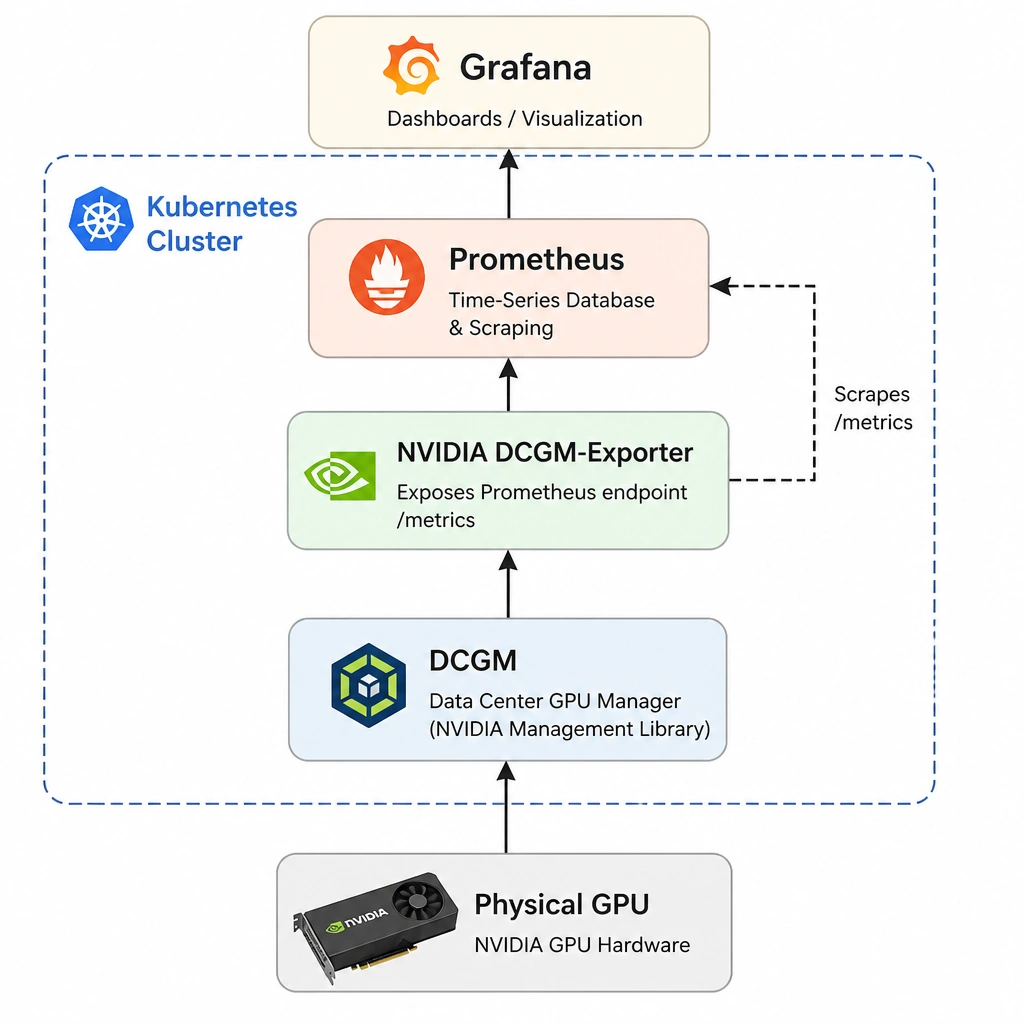
Check this out: when you're running GPUs in Kubernetes, you can't just log into each node and run commands to see how things are going. You need automated, centralized monitoring. Prometheus is the industry-standard tool for scraping metrics, but it doesn't speak 'GPU' out of the box. That's where NVIDIA DCGM-Exporter comes in. It sits on your nodes, gathers data from NVIDIA's Data Center GPU Manager (DCGM), and translates it into the exact format Prometheus expects. Now, don't confuse this with Nsight Systems, which is a developer tool for profiling code performance, or Fleet Command, which is for managing edge deployments. And RAPIDS cuDF? That's a GPU-accelerated data processing library. For monitoring in Kubernetes, DCGM-Exporter is your go-to.
Full explanation below image
Full Explanation
In containerized AI environments, particularly Kubernetes, administrators need real-time visibility into GPU health and utilization. Prometheus is widely used to scrape and store metrics, but it requires endpoints to expose metrics in a specific format. The NVIDIA DCGM-Exporter is the component designed for this exact purpose. It leverages the Data Center GPU Manager (DCGM) engine, which is a suite of tools for managing and monitoring NVIDIA Tesla and newer GPUs in clustered environments. The exporter runs as a daemon (often a DaemonSet in Kubernetes) and translates low-level GPU metrics (such as engine utilization, memory consumption, temperature, power draw, and PCIe throughput) into Prometheus-compatible formats. This allows tools like Grafana to scrape the endpoint and display real-time dashboard visualizations. Let's examine why the other choices are incorrect: Option A (NVIDIA Nsight Systems) is a system-wide performance profiling tool designed to help developers identify bottlenecks in their application code, such as CPU-GPU interactions. It is not an infrastructure metrics collector or exporter. Option B (NVIDIA Fleet Command) is a cloud-managed service used for deploying, managing, and scaling AI applications securely across distributed edge environments. It is not a metrics-exporting agent. Option D (NVIDIA RAPIDS cuDF) is a GPU-accelerated DataFrame library designed for data preparation and manipulation, similar to Pandas but running on GPUs. It has nothing to do with cluster monitoring.