
You need to log GPU utilization and VRAM statistics programmatically within a custom PyTorch training script to trigger automatic garbage collection when memory thresholds are exceeded. Which tool provides a native Python API for GPU querying in addition to its interactive terminal-based monitoring interface?
Select an answer to reveal the explanation.
Short Explanation and Infographic
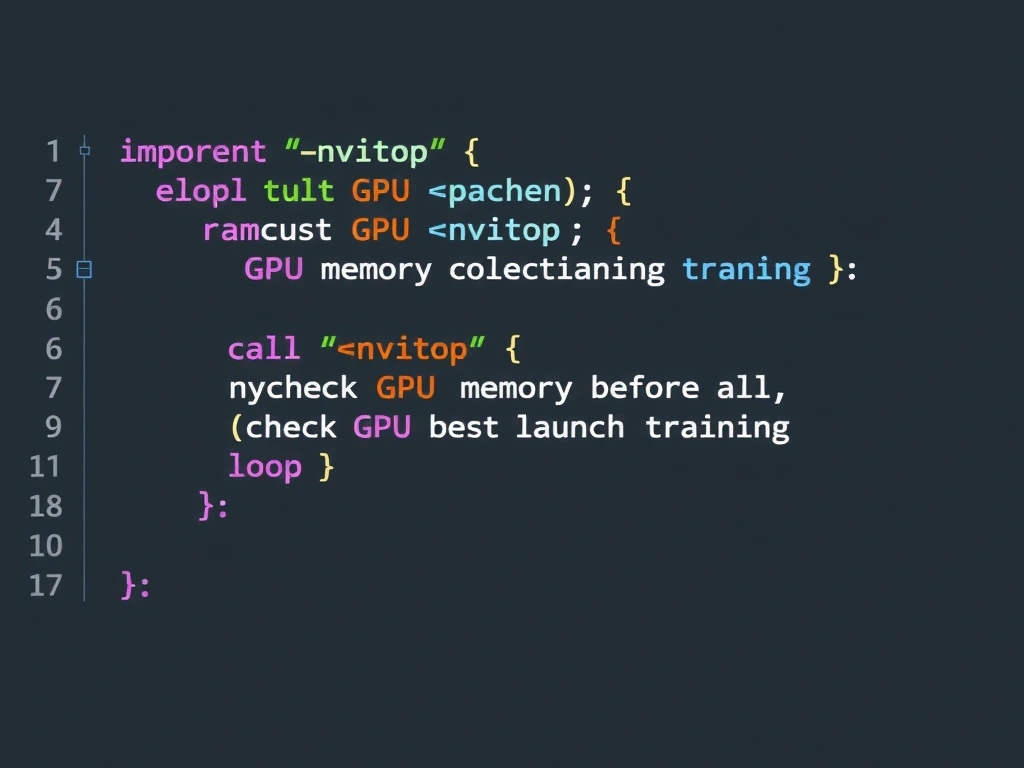
We already know nvitop is awesome for managing GPU processes interactively from the terminal. But here's the cool part: it's not just a CLI tool. It also has a complete Python API! If your training scripts keep crashing with out-of-memory (OOM) errors, you can import nvitop directly into your PyTorch code, monitor VRAM programmatically, and write logic to clean up cache before everything grinds to a halt. Try doing that with gpustat or standard CLI utilities — it's a huge pain.
Full explanation below image
Full Explanation
The correct answer is nvitop. While nvitop is widely recognized for its interactive CLI monitor (similar to htop for GPUs), it is also distributed as a Python package containing a robust, developer-friendly Python API. This allows AI engineers to import nvitop into their machine learning pipelines, query GPU telemetry (utilization, temperature, memory allocation, and process details) programmatically, and implement custom logic (like VRAM-based logging or dynamic batch size adjustments to prevent out-of-memory errors). - gpustat (A) is a command-line tool built on top of nvidia-ml-py, but it does not provide an interactive console UI or a dedicated, high-level Python API suite comparable to nvitop. - HWMonitor (C) is a general Windows hardware utility, not a programmable CLI or API tool for Linux-based deep learning environments. - nvidia-settings (D) is a display configuration GUI for desktop workstations and lacks programmatic interface capabilities for model-training pipelines.