
You just spun up a DGX H100 system in the lab, and you want to quickly check GPU temperatures, memory usage, and power consumption without setting up any fancy monitoring infrastructure. What command-line tool do you reach for?
Select an answer to reveal the explanation.
Short Explanation and Infographic
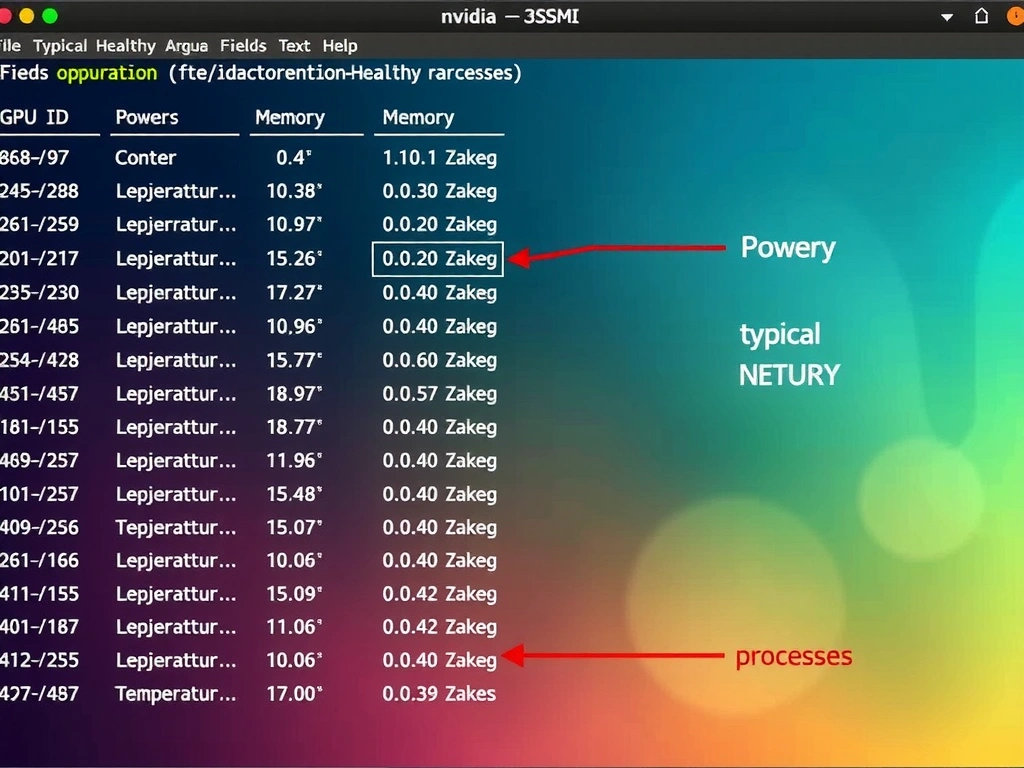
nvidia-smi (NVIDIA System Management Interface) is the go-to tool for quick GPU checks on a single system. Run it, you get utilization, memory, temperature, power, everything in a readable format. ctop monitors containers, NVML is a programmatic library, dcgmi is for data center-scale management.
Full explanation below image
Full Explanation
nvidia-smi is the first tool you reach for when you need a quick GPU health check on a single machine. It's command-line, installed with NVIDIA drivers, and gives you real-time snapshots: GPU ID, temperature, power consumption, memory usage, utilization, running processes. Just run nvidia-smi and you get an ASCII table. Run it repeatedly with watch nvidia-smi and you get live updates. It's perfect for troubleshooting: "Why is training slow?" You run nvidia-smi and see GPU 0 at 35 degrees with power low, but utilization is only 20% — aha, data pipeline bottleneck, not GPU thermal throttling. ctop is for container monitoring — not GPU-specific. NVML (NVIDIA Management Library) is the C/Fortran programming interface that tools like nvidia-smi and DCGM use internally. dcgmi is the command-line interface to DCGM — it's for querying DCGM data that's been collected on a system where DCGM is running. If DCGM isn't running, dcgmi won't help you. nvidia-smi works standalone, which is why it's the quick-check tool.