
During distributed training of a large language model across a cluster of DGX servers, you notice that overall training epoch times are higher than expected. To identify the exact cause of this bottleneck, what monitoring strategy should you implement?
Select an answer to reveal the explanation.
Short Explanation
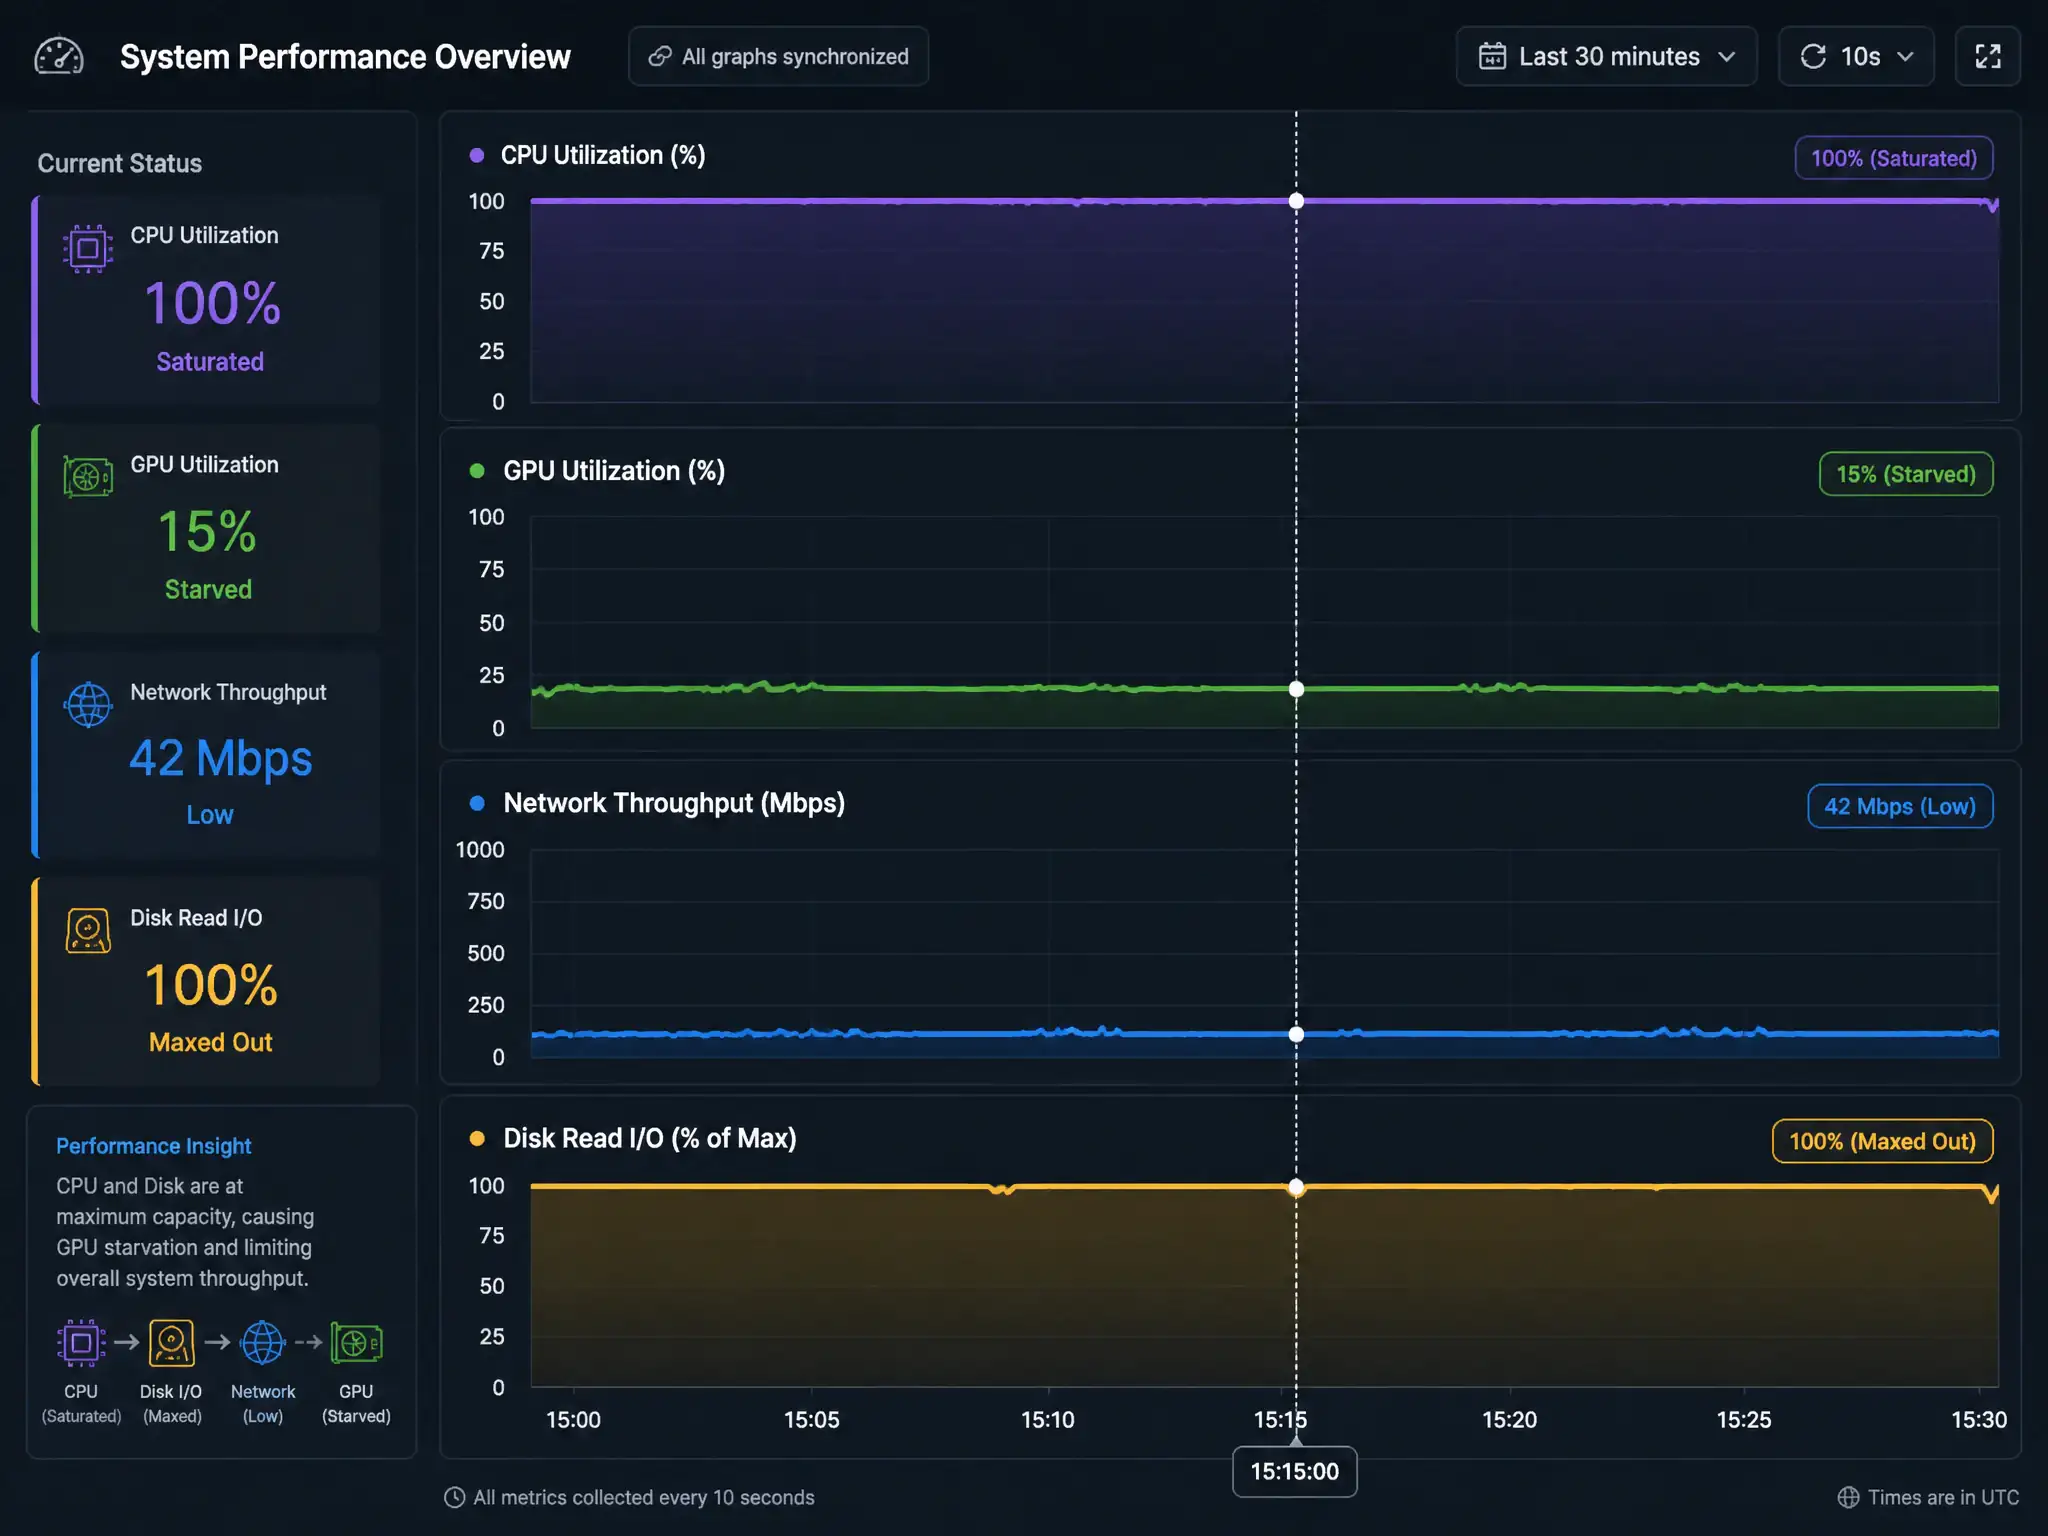
Here's the deal: if your GPUs are idling, don't just blame the GPUs. Watch CPU, GPU, memory, and network fabric together in real time, because a starved GPU usually means data or communication is stuck somewhere else. Job times only tell you it's slow, not why.
Full Explanation
In accelerated computing environments, performance bottlenecks can occur at various stages of the data pipeline. High-performance GPUs require a constant stream of data to keep their CUDA and Tensor Cores saturated, so monitoring only GPU metrics is insufficient. Holistic monitoring tracks four main resources simultaneously: GPU utilization and memory, where high GPU utilization indicates the workload is successfully running on the accelerator and low utilization often means the GPU is starved for data; CPU utilization, because the CPU handles data loading, decompression, preprocessing, and augmentation, and a CPU bottleneck leaves the GPU idle; PCIe and network fabric utilization, including InfiniBand or RoCE, because distributed training requires nodes to exchange gradients frequently and high latency or packet loss can stall GPUs during communication phases such as AllReduce operations; and system memory plus disk I/O, because slow storage read speeds can limit how fast datasets are fed into the system. The exclusive GPU-core-utilization approach is wrong because it fails to diagnose why the GPU is underutilized and ignores the upstream data path through CPU, memory, and storage as well as the downstream communication path through networking. Relying solely on historical job duration reports is wrong because it is a reactive, black-box approach that flags that a run is slow but provides no technical telemetry to diagnose the root cause. Implementing automatic scaling rules based on forecasting models to add compute nodes dynamically is wrong because predictive scaling does not resolve internal hardware bottlenecks; it can merely replicate the bottlenecked configuration across more nodes and waste expensive resources. Therefore, correlating CPU, GPU, memory, and network fabric utilization metrics in real time is the most effective strategy to detect and resolve cluster bottlenecks.