
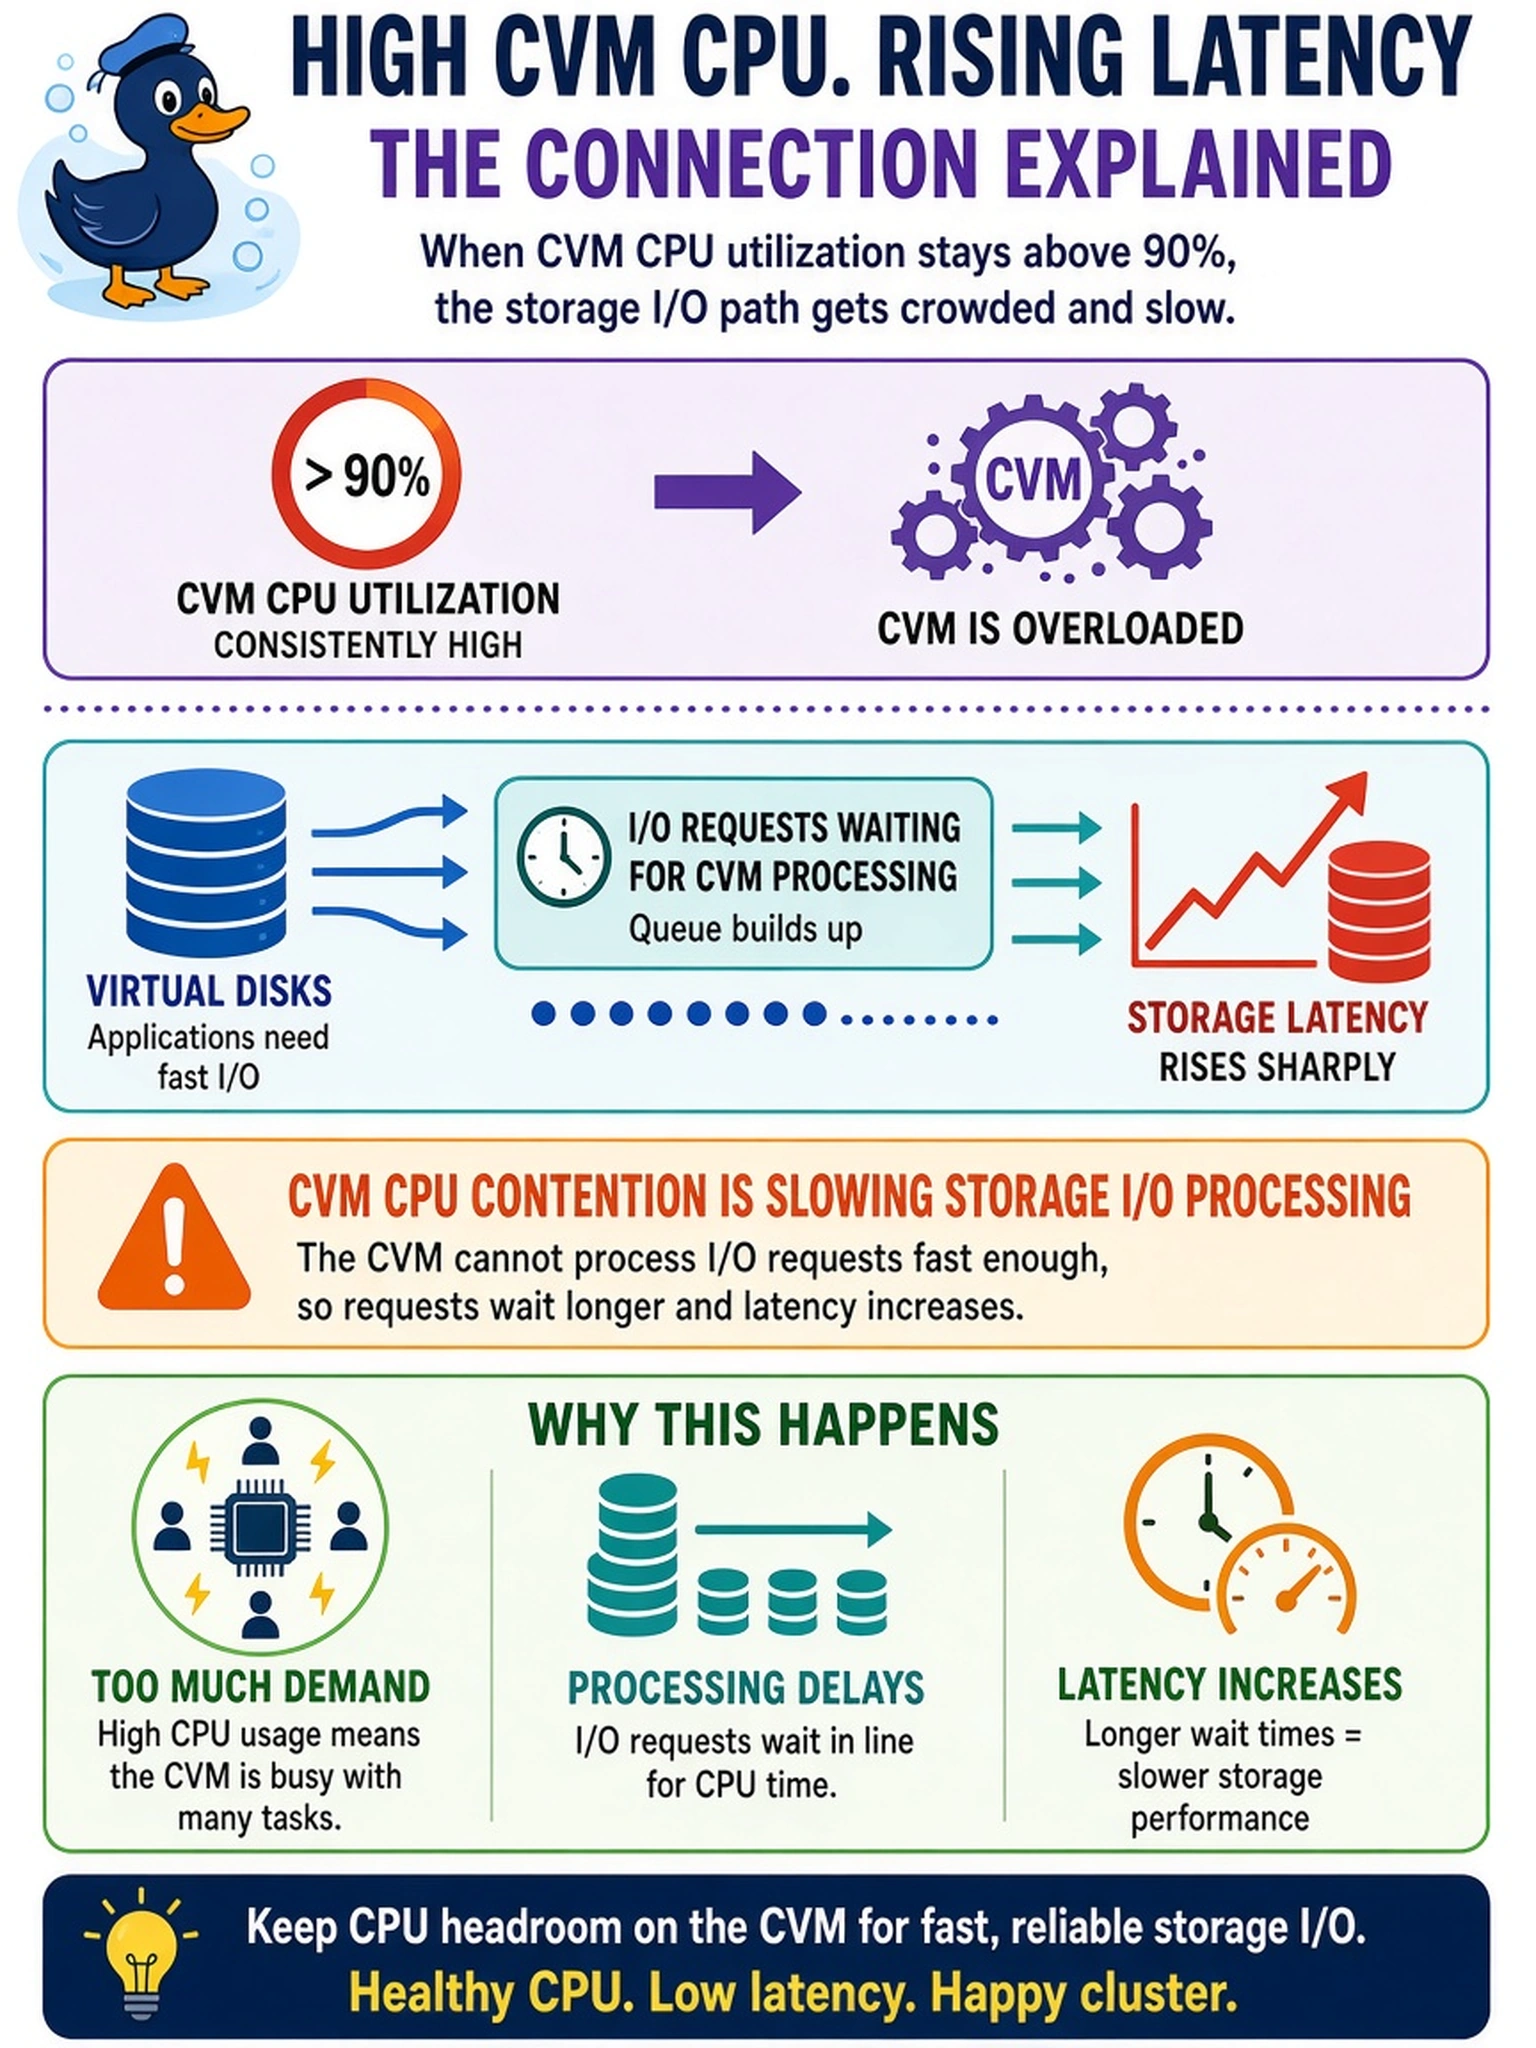
During a Prism performance review, you notice a cluster's CVM CPU utilization is consistently above 90%, while storage latency has risen sharply. Prism shows many I/O requests waiting for CVM processing. Which cause best explains the latency increase?
Select an answer to reveal the explanation.
Short Explanation
Think of the CVM as the traffic cop for storage I/O. If its CPU is pegged, packets of work queue up, and latency climbs even when the disks are fine. You're seeing CPU pressure masquerading as a storage slowdown.
Full Explanation
In a Nutanix cluster, storage I/O from guest VMs is serviced by the CVM, which runs key services such as Stargate and Curator. When CVM CPU saturation is sustained, the CVM cannot dequeue and process I/O requests quickly enough, so requests wait in queues and the measured storage latency rises. High IOPS can still be present because the workload is generating pressure, but the bottleneck is CVM CPU, not the underlying disks. Guest VM memory ballooning can degrade an application and may add I/O waits, but it would not explain persistent CVM CPU saturation or cluster-wide storage latency without VM-level memory alarms. AHV bridge packet loss can cause network timeouts or retransmissions, yet it would not normally produce the CVM CPU contention and I/O queueing pattern described here. SSD write endurance exhaustion would surface through media health, wear, or remap alerts and could cause errors, but it is not the primary cause when the visible symptom is CVM CPU pressure. Exam caveat: correlate storage latency with the same CVM or cluster CPU trend before blaming disks, network, or guest memory. Operational check: in Prism, compare CVM CPU and storage latency over the same window, inspect CVM CPU and I/O queue metrics, then evaluate working-set growth, compression or dedupe activity, snapshots, rebalancing, or Curator pressure.