
An application team reports slow response times on several AHV VMs. Prism Central shows normal latency, IOPS, throughput, and no active alerts when you look at the last hour. What should you do first to determine whether performance has regressed?
Select an answer to reveal the explanation.
Short Explanation
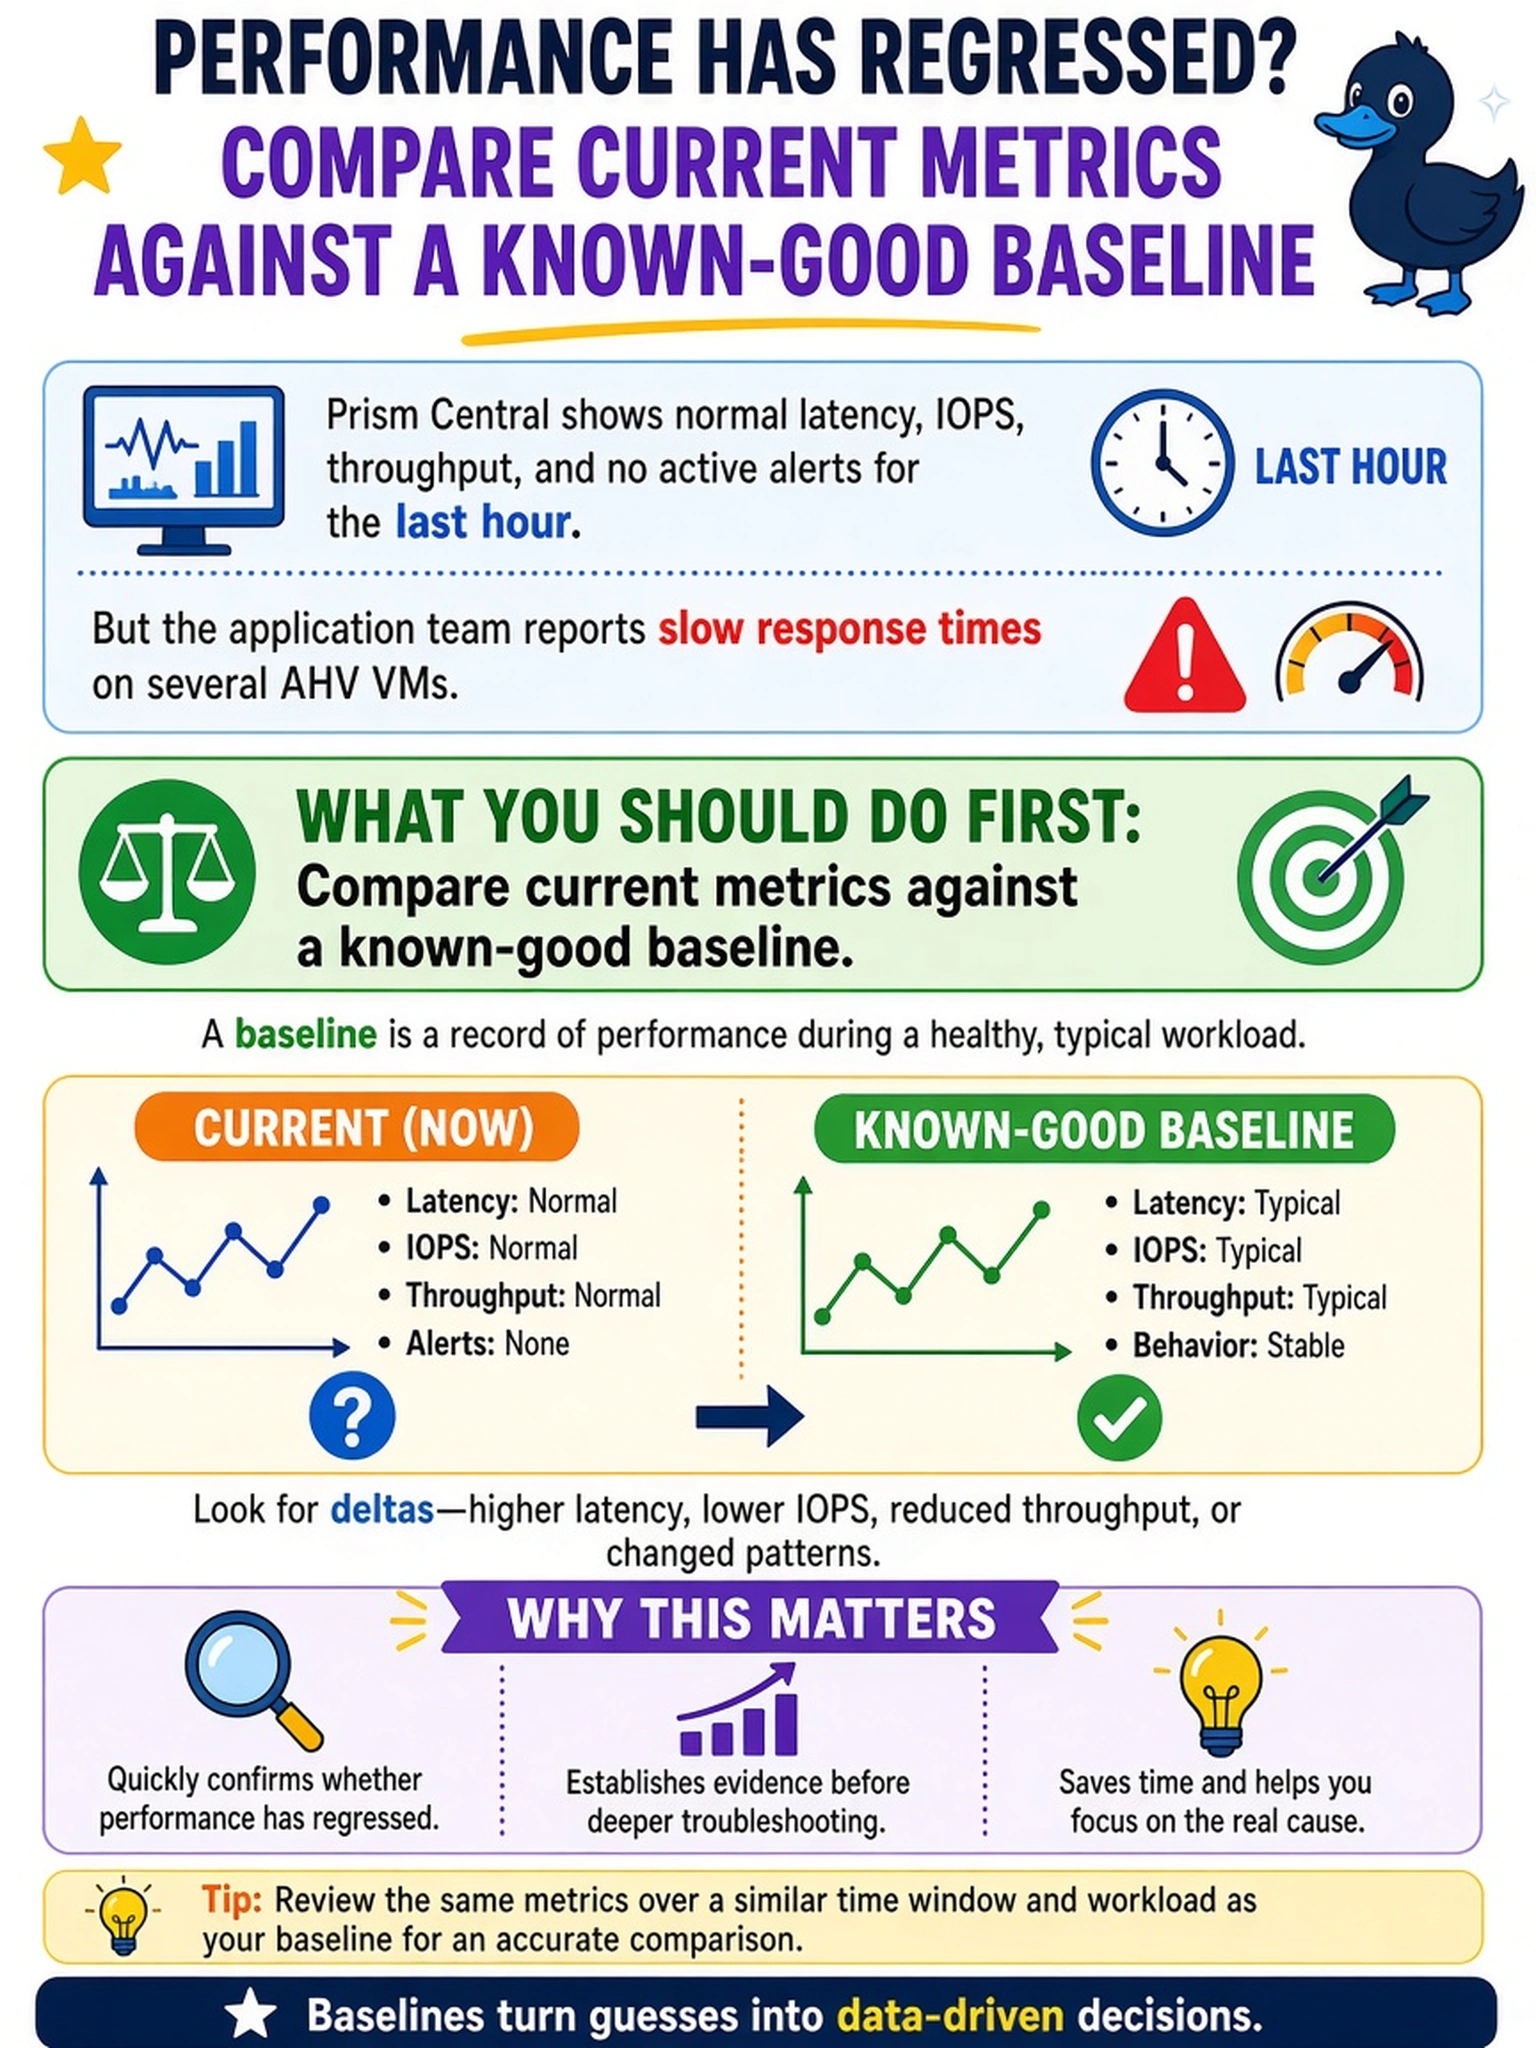
Think of performance like your heartbeat: a normal reading now doesn't prove nothing changed. You need to compare today's metrics with a known-good baseline from before the slowness. That's how you spot a regression hiding inside 'normal' numbers.
Full Explanation
Performance troubleshooting should establish whether behavior has changed before changing the environment. When current latency, IOPS, throughput, and alerts appear normal, the next logical step is to compare the same metrics from the affected VMs and storage containers against a known-good baseline from an earlier period. This reveals regressions such as increased average latency, longer queue depth, lower cache hits, or a working set that has grown beyond what the cluster was sized to handle. Scaling resources without evidence can mask a workload change, storage contention, or a configuration drift and wastes capacity. Full health checks are useful when symptoms suggest node, CVM, disk, or service faults, but they are not the first action when the scenario already states that current monitoring is normal and no alerts are present. Reviewing current alerts for hardware failure is similarly weak because active alerting and failed-disk indicators would usually accompany hardware problems, while a regression can exist with no alerts. Exam caveat: when metrics look normal but users report slowness, choose trend or baseline comparison over reactive scaling or broad health checks. Operational check: pull the affected VM and container metrics for the current window and a comparable known-good window, then compare latency, IOPS, throughput, queue depth, and working-set size.