
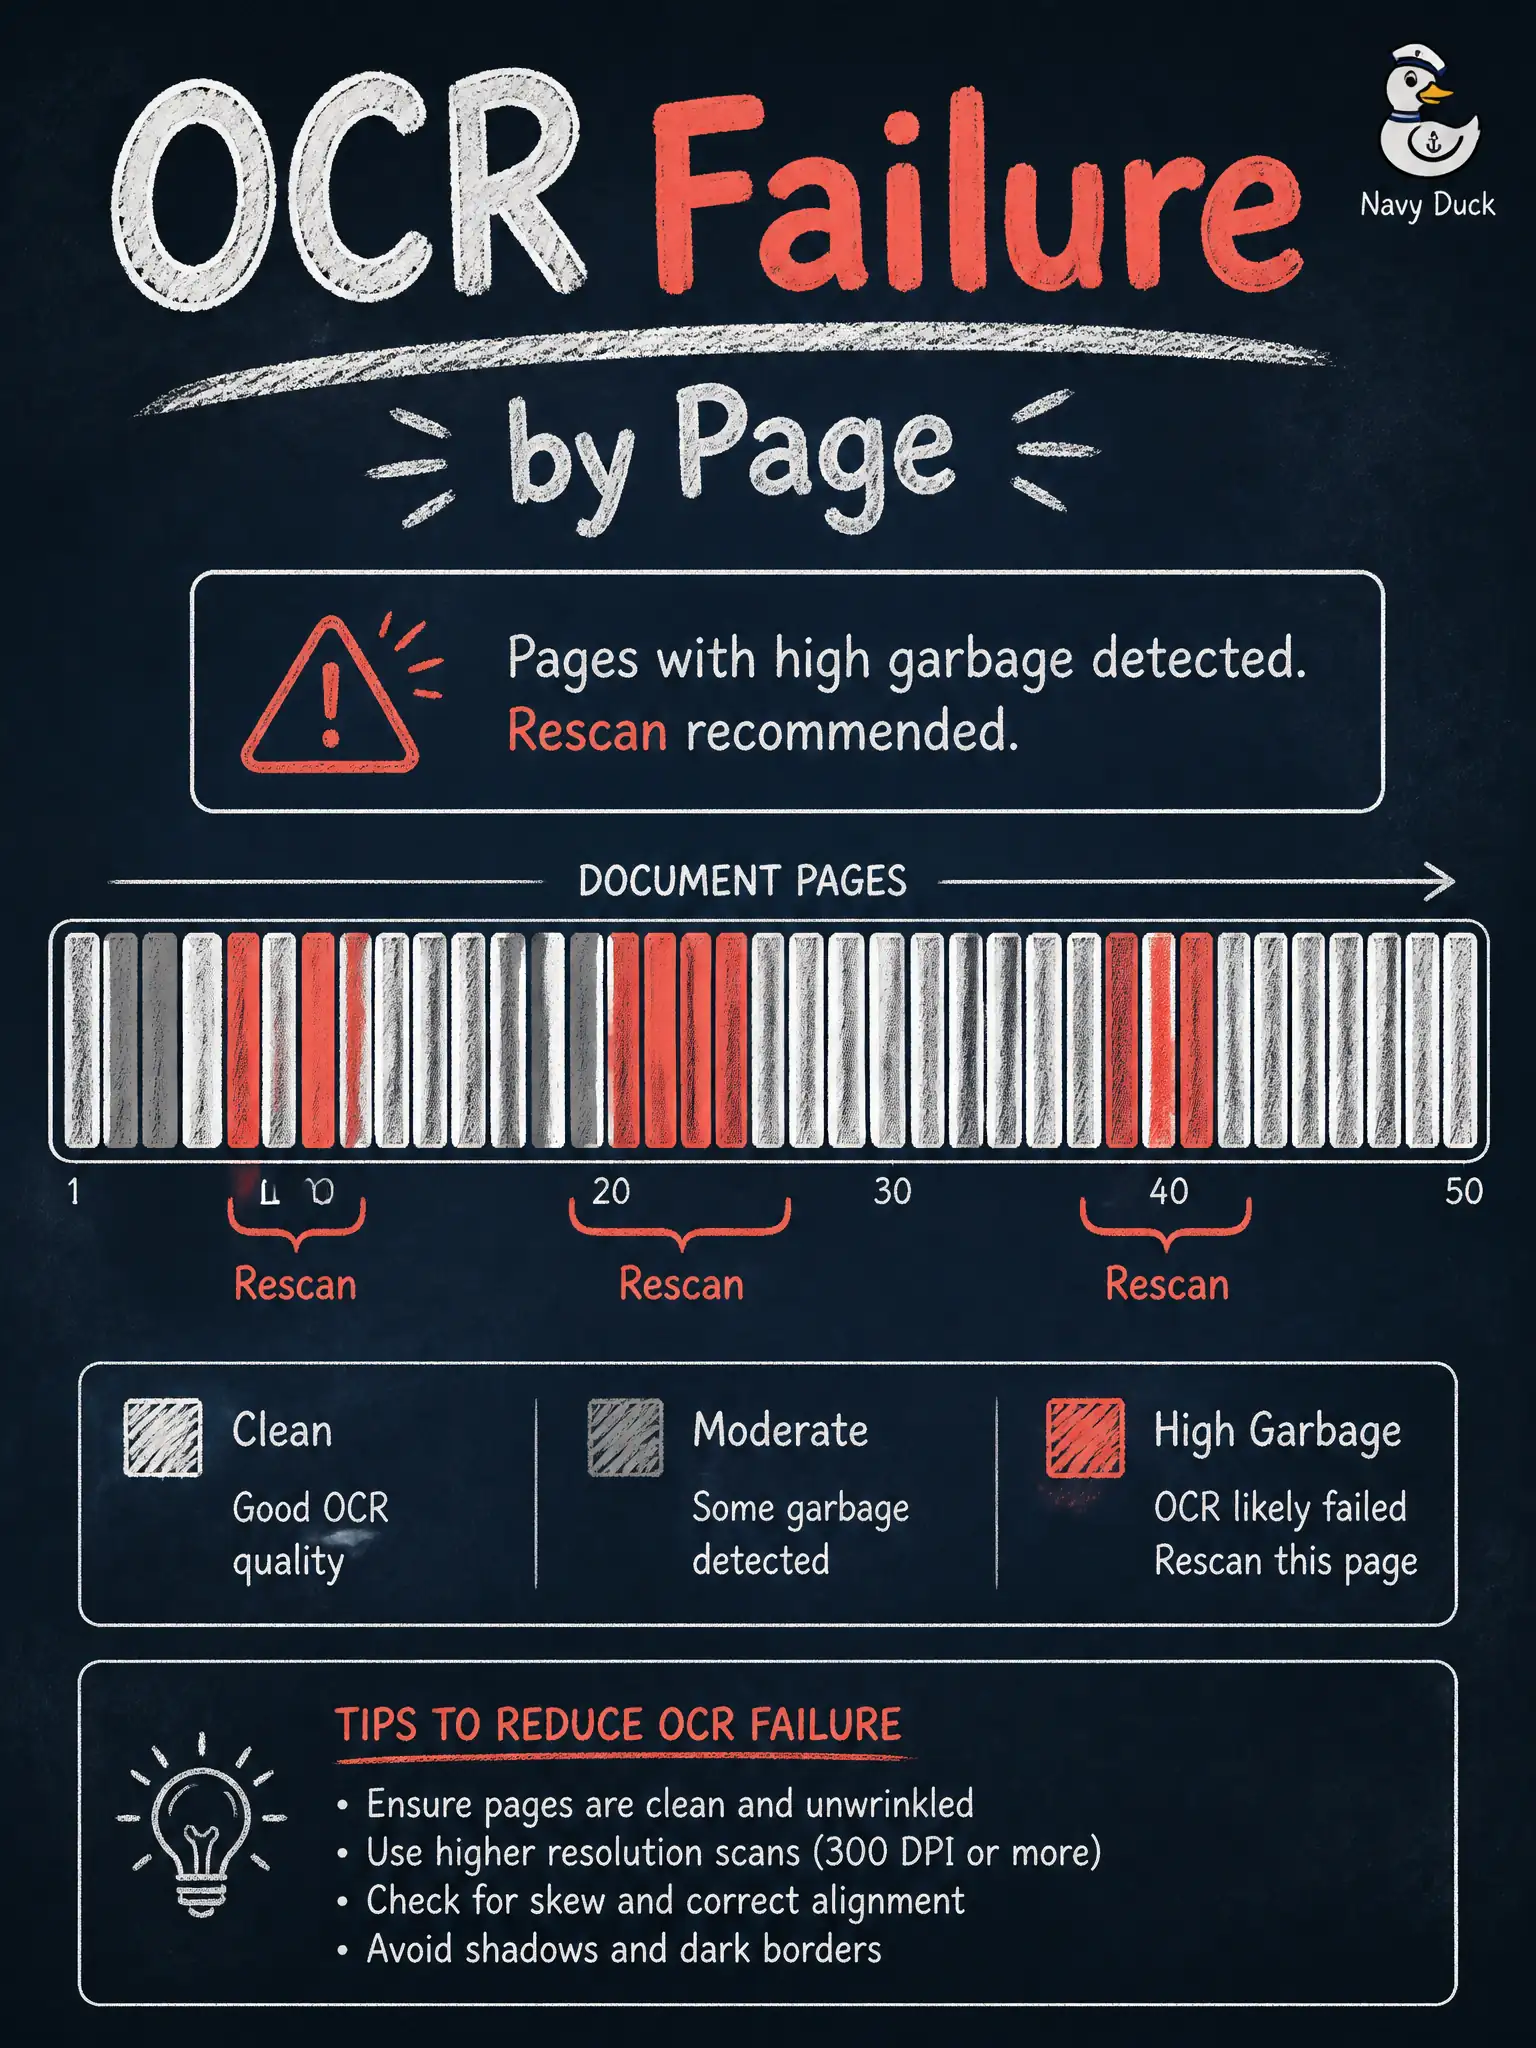
A chalk-pit office runs OCR across a hundred-page PDF and shades pages with high garbage rates. What is that page chart for?
Select an answer to reveal the explanation.
Short Explanation
Shading the messy pages on a map tells the crew where to rescan. The chart is document analysis of OCR failure—not a new network architecture.
Full Explanation
Running OCR across a hundred-page chalk-pit PDF and shading pages with high garbage rates is document analysis that shows which scans need a cleaner OCR pass. The page chart is a Domain 5 quality triage tool for civic document text—not an architecture failure declaration.
Declaring a training-architecture failure that needs a new backbone fails because garbage-rate shading diagnoses scan/OCR quality, not backbone choice. Proving Domain 4 must redeploy Helm before any page is reread fails because serving scale does not clean bad OCR pages. Replacing OCR with CLIP similarity on every page thumbnail fails the document-text extraction job; similarity on thumbnails does not yield analyzable list text.
Exam caveat: OCR garbage maps guide rescans and OCR settings. Keep them in Domain 5 document analysis; do not escalate to Helm or CLIP substitutions.
Operational check: threshold garbage rates; queue high-garbage pages for rescan or OCR retune; re-shade after cleanup; only then use cleaned text beside chalk-pit stills in municipal analysis packets. In municipal multimodal stewardship, record the chosen Domain 5 reading and the rejected distractors in the loft change log so future stewards understand which concept boundaries were enforced for citizen-facing archives. Re-check the same chart or extraction after the next collection or OCR pass to confirm the civic gap is closing rather than merely relabeled.