
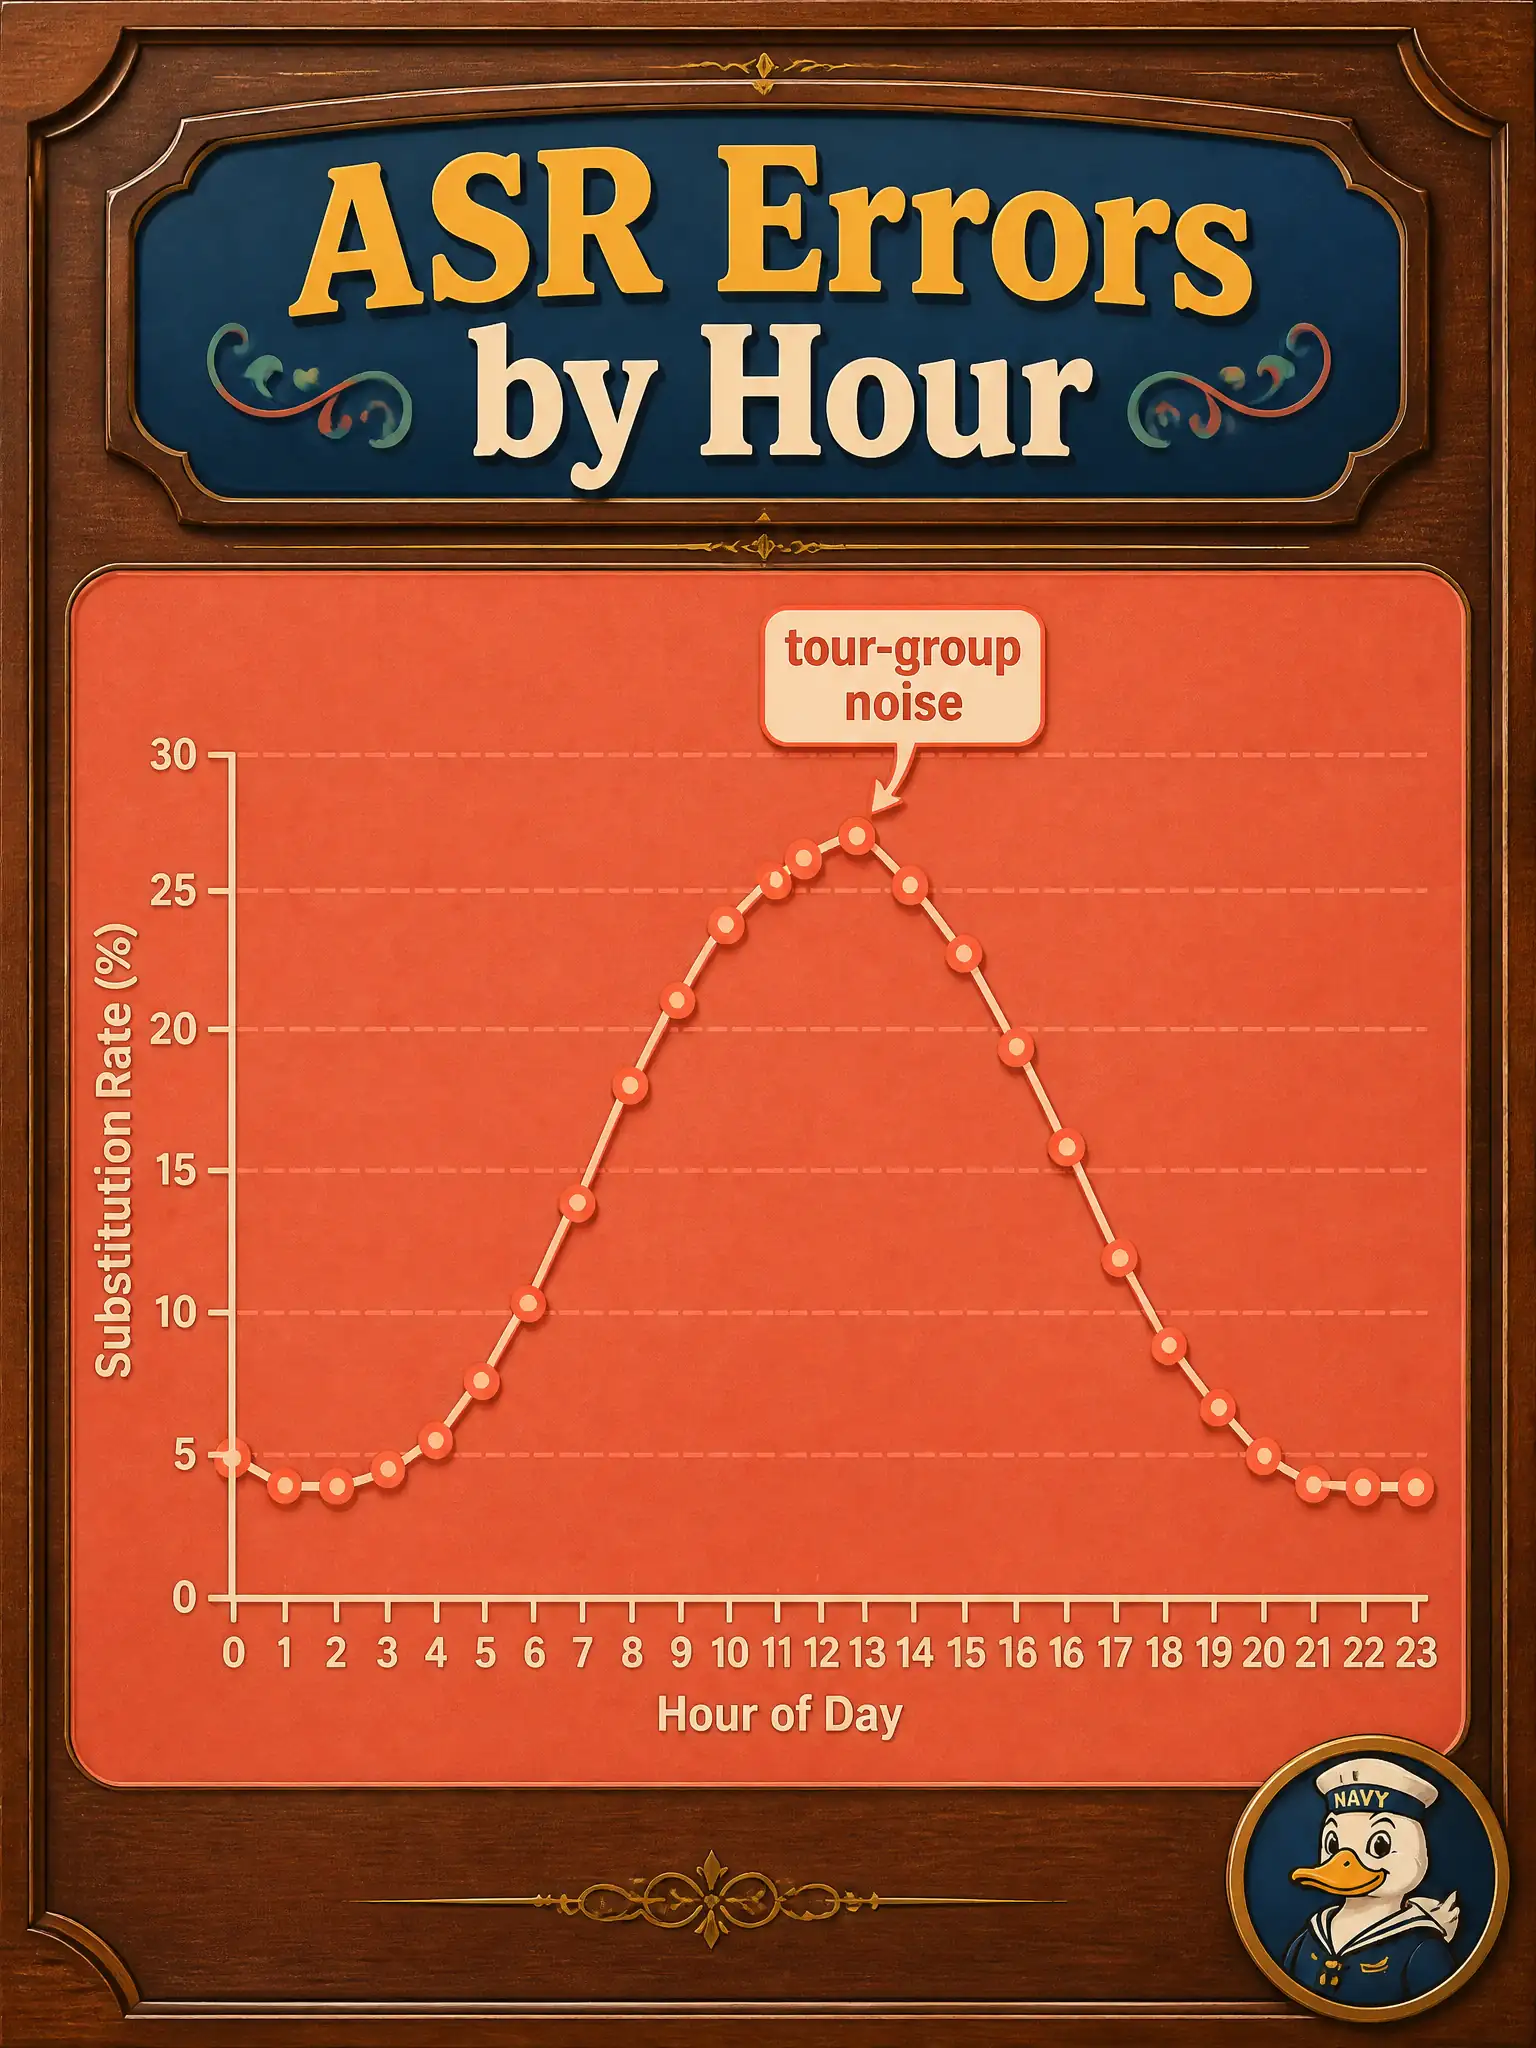
A visitor-center stereoscope parlor plots Riva ASR substitution errors against clock hour and sees a midday tour-group spike. How should that plot be interpreted?
Select an answer to reveal the explanation.
Short Explanation
When errors spike at noon with tour groups, the chart is telling you about noise and crowd conditions in the audio corpus—not begging for a Helm rewrite.
Full Explanation
A visitor-center plot of Riva ASR substitution errors against clock hour that spikes at midday tour groups is Domain 5 analysis of the speech arm and booth conditions over time. Crowd noise, overlapping talk, and busier acoustics are corpus and environment patterns. The chart guides collection or booth-condition remediation for the audio arm—not an automatic infrastructure rewrite.
Reading the spike as a Helm-scale item that requires more Riva pods immediately fails because replica count addresses capacity and latency under load, not whether midday acoustics corrupt recognition quality. Treating the plot as a Domain 1 write-up that the vocabulary file must be replaced today fails because a time-of-day error curve points first to conditions and sampling, not an instant vocabulary redesign without further evidence. Claiming Riva ASR cannot be used in public booths at all fails as an overgeneralization from one environmental spike; public booths need condition-aware analysis, not abandonment of the speech stack.
Exam caveat: separate quality/corpus analysis from scale. Time-of-day ASR charts are Domain 5 exploratory tools; Helm changes belong when measurement shows capacity, not when midday noise is the signal.
Operational check: segment error rates by hour and tour density; sample midday clips for SNR and overlap; add quieter booth practices or targeted midday training pairs before changing Helm or vocabulary; re-plot after remediation so the civic visitor center can show the spike declining.