
A 40-kW commercial rooftop array underperforms on clear days after visual inspection shows no major soiling or shade. The O&M lead assigns IV curve tracing on suspect strings. Which IV curve tracer practice should the technician use to isolate the electrical fault?
Select an answer to reveal the explanation.
Short Explanation
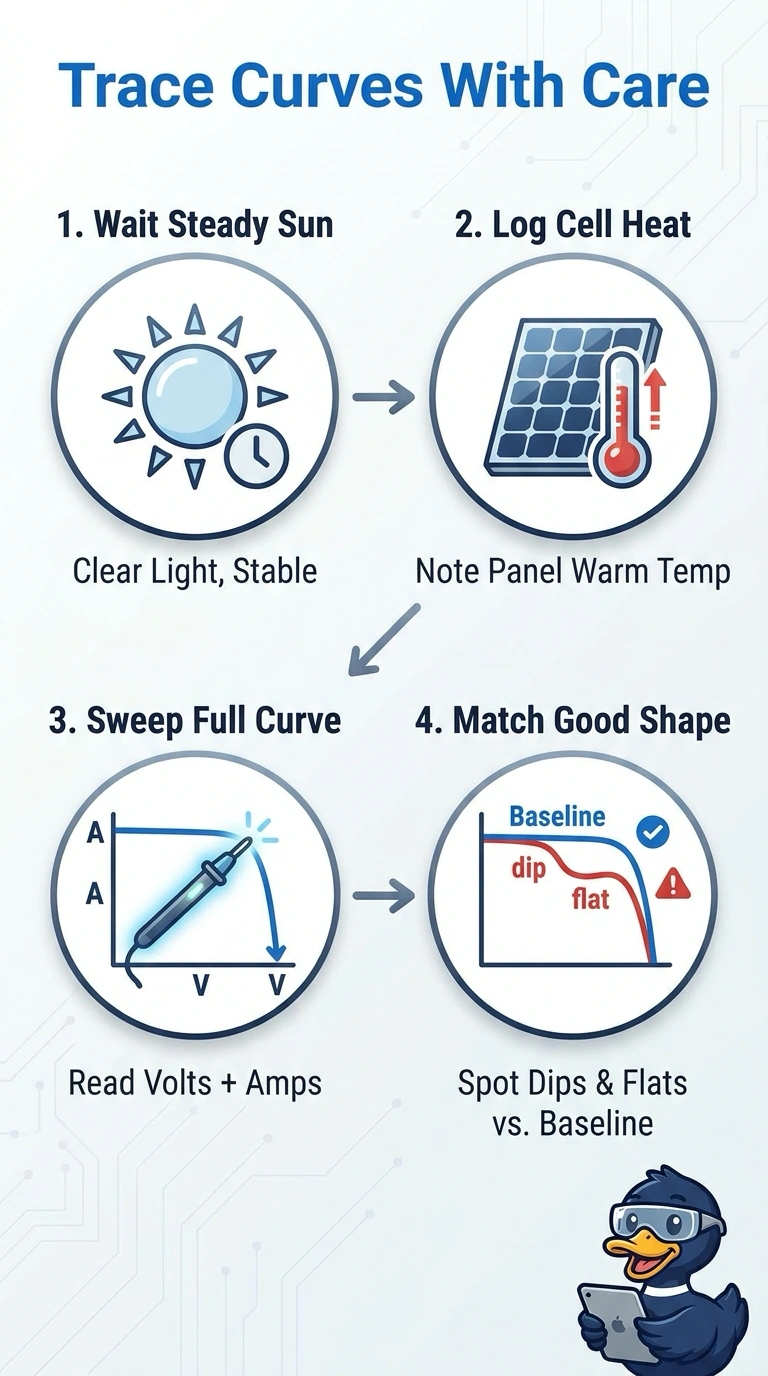
Great troubleshooting instinct—the curve shape tells the story. Stable sunlight and a recorded module temperature let comparison reveal whether you face shade, mismatch, or weak cells.
Full Explanation
The sound practice is to record string IV curves in stable sunlight, note module temperature, and compare the full curve shape with the expected baseline. This controls measurement conditions and makes differences in current, voltage, fill factor, or curve features useful for localizing electrical faults instead of confusing normal operating variation with a defect. Tracing in steady sunlight and comparing curve shapes is not enough if module temperature is omitted, because temperature influences voltage and weakens the comparison. Recording temperature and using stable conditions, but comparing only maximum power, reduces the curve to one number; distinct faults can cause similar power losses while producing different curve shapes. Recording temperature and comparing curve shapes with manufacturer datasheet curves uses a generic reference, not necessarily the array’s expected operating baseline; installation, aging, and prior performance can make that reference misleading when isolating a new fault. Exam caveat: even a well-controlled curve comparison indicates an electrical anomaly, but does not by itself prove which component caused it. Practical check: verify irradiance is sufficiently steady and consistent across the compared traces, and confirm the baseline uses compatible operating conditions before interpreting deviations.